A Missing Timeout Let a Slow Service Stall CircleCI
CircleCI's 2 July outage began when API threads waited on a slow data service with no timeout. The timeline, thread starvation and five changes that bound it.
Quick Answer
CircleCI's 2 July 2026 outage began when a data service slowed under combined maintenance and customer deletion load. API connections to that service had no timeout for slow responses, so threads piled up until the API layer went unresponsive and failed health checks. The fix is to bound every wait, cap concurrency per dependency, throttle background jobs and alert on early resource pressure.
A missing timeout is one of the cheapest bugs to write and one of the most expensive to find during an incident. CircleCI's post-incident report for 2 July 2026 describes one, and it is clear enough to use as a worked example.
We keep this post on the application-layer story, which is threads waiting on a slow service. The network-layer story from the same day, and the failure class that links the two, are in our analysis of stuck state at Railway and CircleCI.
Here we walk through the timeline, show why a slow dependency exhausts a thread pool, list the design changes that bound the damage, and say when a timeout alone is not enough.
A Maintenance Job Met a Customer Workload Mid-Afternoon
The report gives a compact timeline in UTC. We have added the intervals between events, because they show where the time went.
| Time (UTC) | Event in the report | Interval since previous |
|---|---|---|
| 13:30 | Engineers start a data deletion job made of hundreds of maintenance tasks | Start |
| 14:40 | Unrelated customer project deletion requests begin executing | 70 minutes |
| 15:12 | Combined load slows an internal data service and failures cascade | 32 minutes |
| 15:16 | Monitoring alerts and engineers are paged | 4 minutes |
| 15:30 | Services scaled up and the long-running maintenance task cancelled | 14 minutes |
| 16:44 | All customer-facing services return to normal | 74 minutes |
Detection was fast, at four minutes from first failure to page. The longer stretch is the 74 minutes between the mitigation at 15:30 and normal service at 16:44. We read that as the time it takes a saturated system to drain, and a system with bounded waits drains faster.
One more detail from the timeline deserves attention. The maintenance job started at 13:30 and the failure began at 15:12, which means the system tolerated the job for nearly two hours before a second workload tipped it over. A threshold that only trips at the moment of failure gives no warning for that long window, and we would want a signal that moves earlier, such as rising latency on the data service during the job.
The report names the trigger as a combination of internal maintenance and customer-initiated deletions running at the same time. Neither workload was unusual alone, which is why load tests of each in isolation would not have shown the problem.
How a Missing Timeout Exhausts a Thread Pool
The report's root cause is specific. Connections between the API layer and the workflows data service were not configured to time out slow responses under elevated load, so threads were exhausted and the request routing layer failed. In its words, "The API-handling components became overwhelmed, went unresponsive, and began failing health checks."
The mechanism is general, and Google's SRE book describes it in its chapter on addressing cascading failures. "Thread starvation can directly cause errors or lead to health check failures," it says. We find the last clause the most important, because a failing health check is how a slowdown in one service becomes an outage in another.
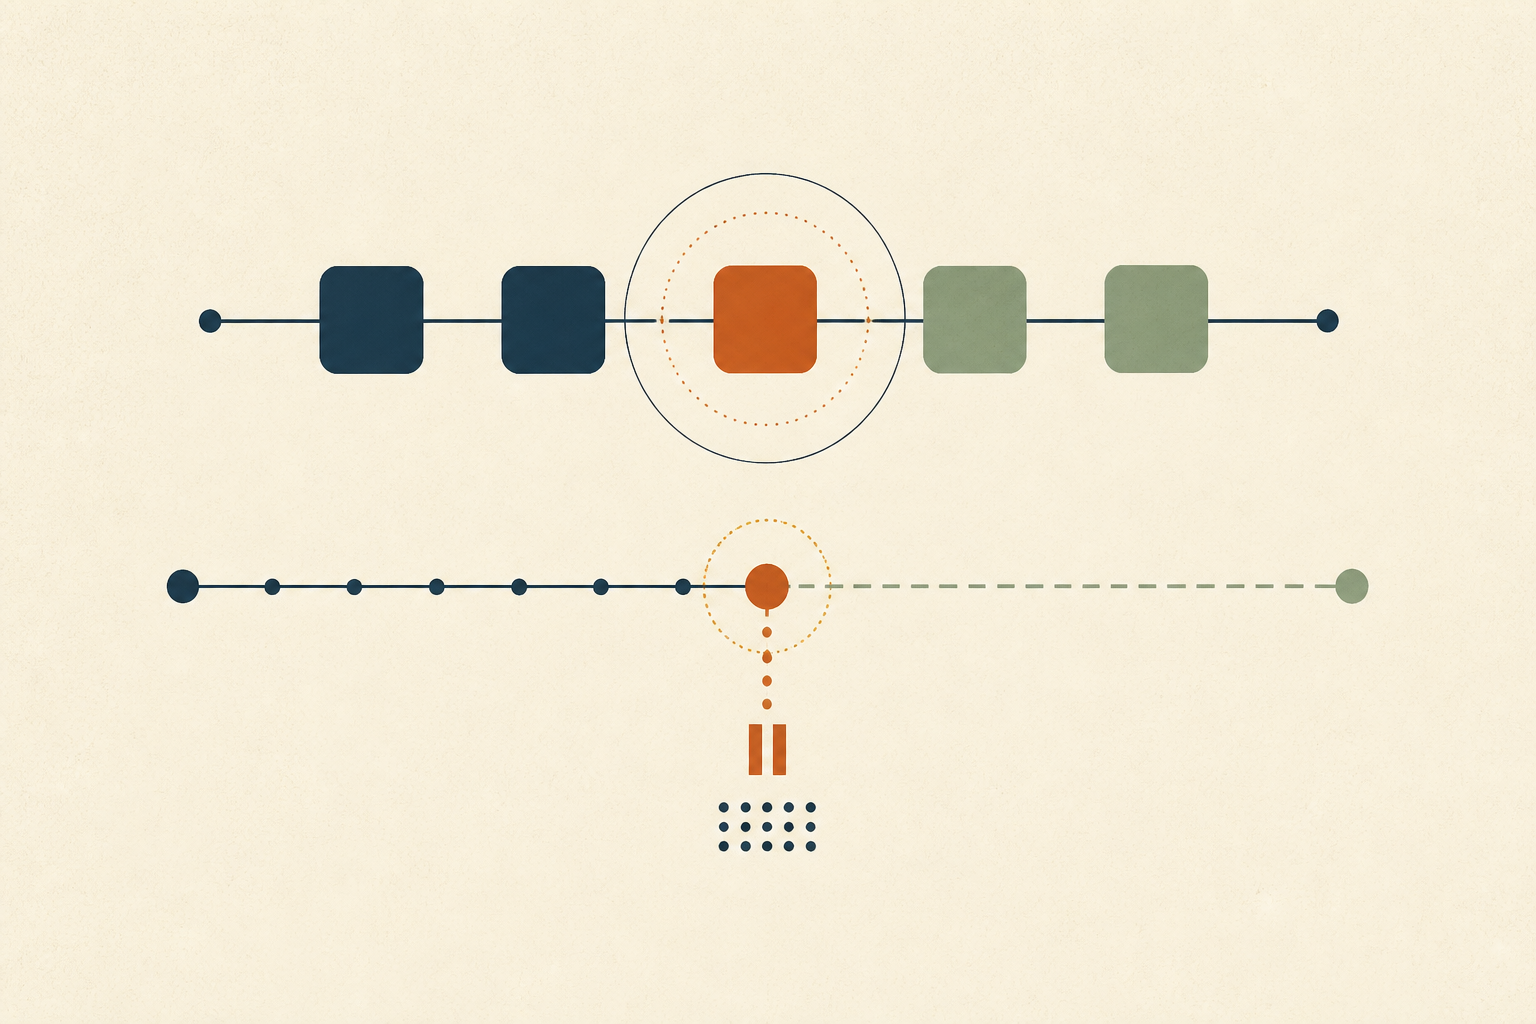
The sequence is simple once drawn out. A dependency gets slower, so each request holds a thread for longer. With a fixed pool, arrivals soon outnumber free threads, so queues grow and later requests wait even for work that has nothing to do with the slow dependency. Without a timeout nothing ever frees a thread, and the pool fills with requests that were doomed from the start.
Bound Every Wait and Every Queue
We would make five design changes before relying on anything cleverer. They are ordered by how much damage each prevents per hour of work.
1. A Timeout on Every Outbound Call
Every client of a dependency needs a deadline shorter than the caller's own deadline. A request that cannot finish usefully should fail early and release its thread, which is exactly what CircleCI reports it added afterwards.
2. A Concurrency Cap per Dependency
Limit how many threads may wait on any single downstream service. When the cap is reached, new calls fail immediately, and the rest of the pool stays free for requests that do not touch the slow service.
3. Load Shedding Before Saturation
The SRE book defines it plainly. "Load shedding drops some proportion of load by dropping traffic as overload approaches." Rejecting a fraction of requests early is cheaper than failing health checks for everyone.
4. Throttled Background Work
The trigger here was a maintenance job. CircleCI says it is investigating resource limits on background data tasks, and we would go further. Background work should run at a rate that responds to the health of the shared service, and it should be the first load shed.
5. Alerts on Early Resource Pressure
Alert on queue depth, thread pool occupancy and downstream latency before health checks fail. The report lists improving observability and alerting on the affected data service among its follow-ups, which points at the same gap.
| Change | What it prevents | Cost to adopt |
|---|---|---|
| Outbound timeouts | Threads held forever by a slow dependency | Low, but values need testing |
| Concurrency caps | One dependency consuming the whole pool | Moderate |
| Load shedding | Overload becoming a full outage | Moderate to high |
| Throttled background work | Maintenance competing with customers | Low to moderate |
| Early pressure alerts | Learning about saturation from health checks | Low |
Retries deserve the same scrutiny. If your team already has a retry policy, check it alongside these, because aggressive retries turn a slow dependency into a flood, and our guide to diagnosing a retry storm by its amplification factor shows how to measure that.
Why Timeout Values Are Harder Than They Look
Setting a timeout is easy, and choosing its value is where teams go wrong. Too long and it protects nothing, because the pool still fills before the first request times out. Too short and healthy but slow requests are killed, which feeds retries and adds load.
We would derive the value from the dependency's observed latency tail and from the caller's own deadline. AWS describes one method in its Builders' Library article on timeouts, retries and backoff with jitter. It says to "choose an acceptable rate of false timeouts (such as 0.1%)" and then look at the matching latency percentile on the downstream service. The same article warns that retries which add load during an overload can delay recovery by keeping the load high after the original issue is resolved. Our write-up on how a deadline error names the caller, not the slow hop explains how to read the error that results when a deadline fires.
The same discipline applies to connection pools. Our analysis of connection pool exhaustion at WorkOS shows a case where waiting on resources while holding others produced the stall.
When a Timeout Alone Does Not Save You
Timeouts bound a single wait, and they do not repair a system that is already overloaded. If every request still arrives while the data service is slow, a timeout turns hanging requests into failing ones, which is better but still an outage for the affected path.
Two further limits matter. A timeout does not help if the work behind it keeps running, because an abandoned request can still hold locks or consume the data service after the caller gave up. And it does not remove the need for capacity. CircleCI scaled up services as part of its response, which tells us extra headroom was part of the recovery.
We would therefore treat the five changes as a set. Timeouts free threads, caps contain the blast radius, shedding protects the core and throttling removes the trigger.
Finding This Failure Faster Next Time
The investigation question at 15:12 was why API workers had stopped responding, and the answer lay in the interaction between a maintenance job, customer deletions and an unbounded wait. That kind of answer needs evidence from several places at once, namely job schedules, thread dumps, downstream latency and configuration.
That is the cross-system search where we would use dedicated AI agents that monitor production systems and investigate problems, with a person deciding what to change. The report does not describe CircleCI's investigation method, so we make no claim about how it found the cause.
Fix the Missing Timeout Before the Next Slowdown
We read the July 2 report as a reminder that incidents are often waiting in configuration. A missing timeout looks harmless in code review and costs hours in production. We would search our own services for three things this week.
- Outbound calls that have no deadline, or a deadline longer than the caller's own.
- Pools that have no cap per dependency, so one slow service can take every thread.
- Background jobs that run at full speed against systems that customers share.
We would start with the busiest shared dependency and fix its callers first. If you want agents to help gather the evidence during the next incident, Operate runs dedicated AI agents that investigate production problems with cited evidence and propose fixes for your team to review.
Frequently Asked Questions
We follow CircleCI's report, which names a combination of internal maintenance and customer project deletions running together. That slowed a data service, and API connections without timeouts for slow responses exhausted threads until the API layer went unresponsive and failed health checks.
We use it to mean a service running out of free threads because too many are waiting on something slow. New requests then queue or fail, including requests unrelated to the slow dependency, and health checks can fail even though the process itself is running.
We follow Google's SRE definition, which is dropping a proportion of traffic as overload approaches. The aim is to fail a small fraction quickly and cleanly so the rest of the system keeps working, instead of letting every request slow down together.
We start from the dependency's observed latency tail and the caller's own deadline, then test the value under load. A timeout that is too long protects nothing, and one that is too short kills healthy requests and can feed retries, so we review it after incidents.
We would limit it. Background jobs should run at a rate that responds to the health of the shared service, and they should be the first load shed. CircleCI says it is investigating resource limits on its background data tasks for this reason.
About the author

Operate Team
The team behind Operate
Operate Team builds Operate, enterprise AI agents for production operations. Operate answers production questions from Slack and Microsoft Teams, investigates alerts, and reviews performance, security and cost. It finds the root cause with evidence and proposes a fix for an engineer to review, with controlled access to your systems.