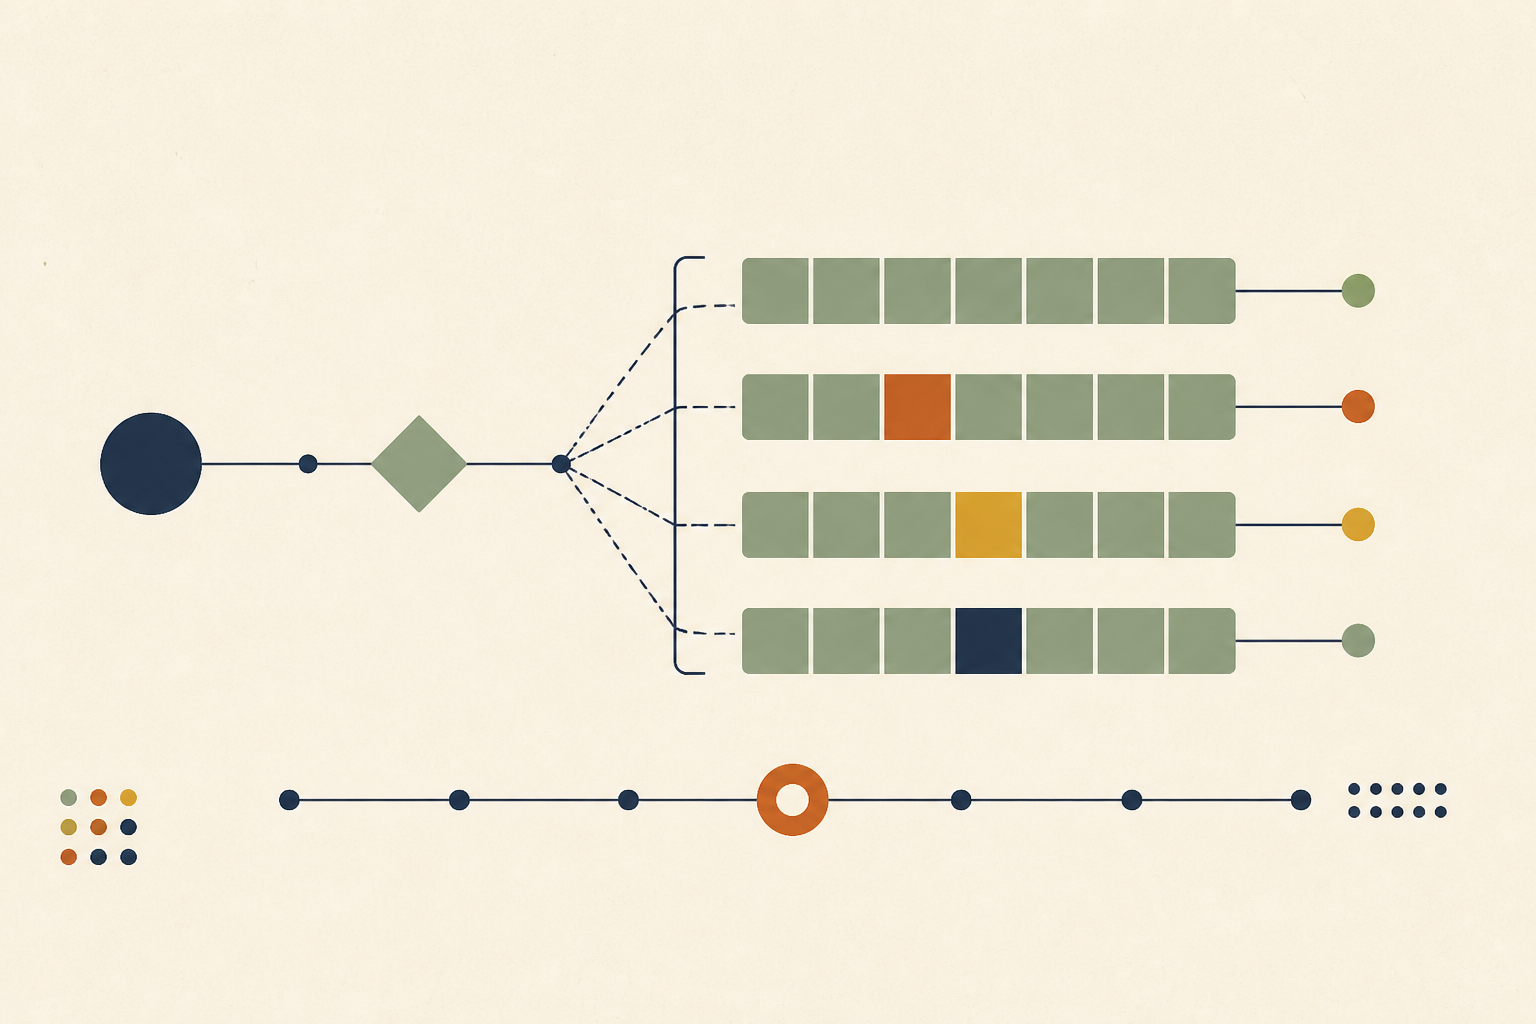
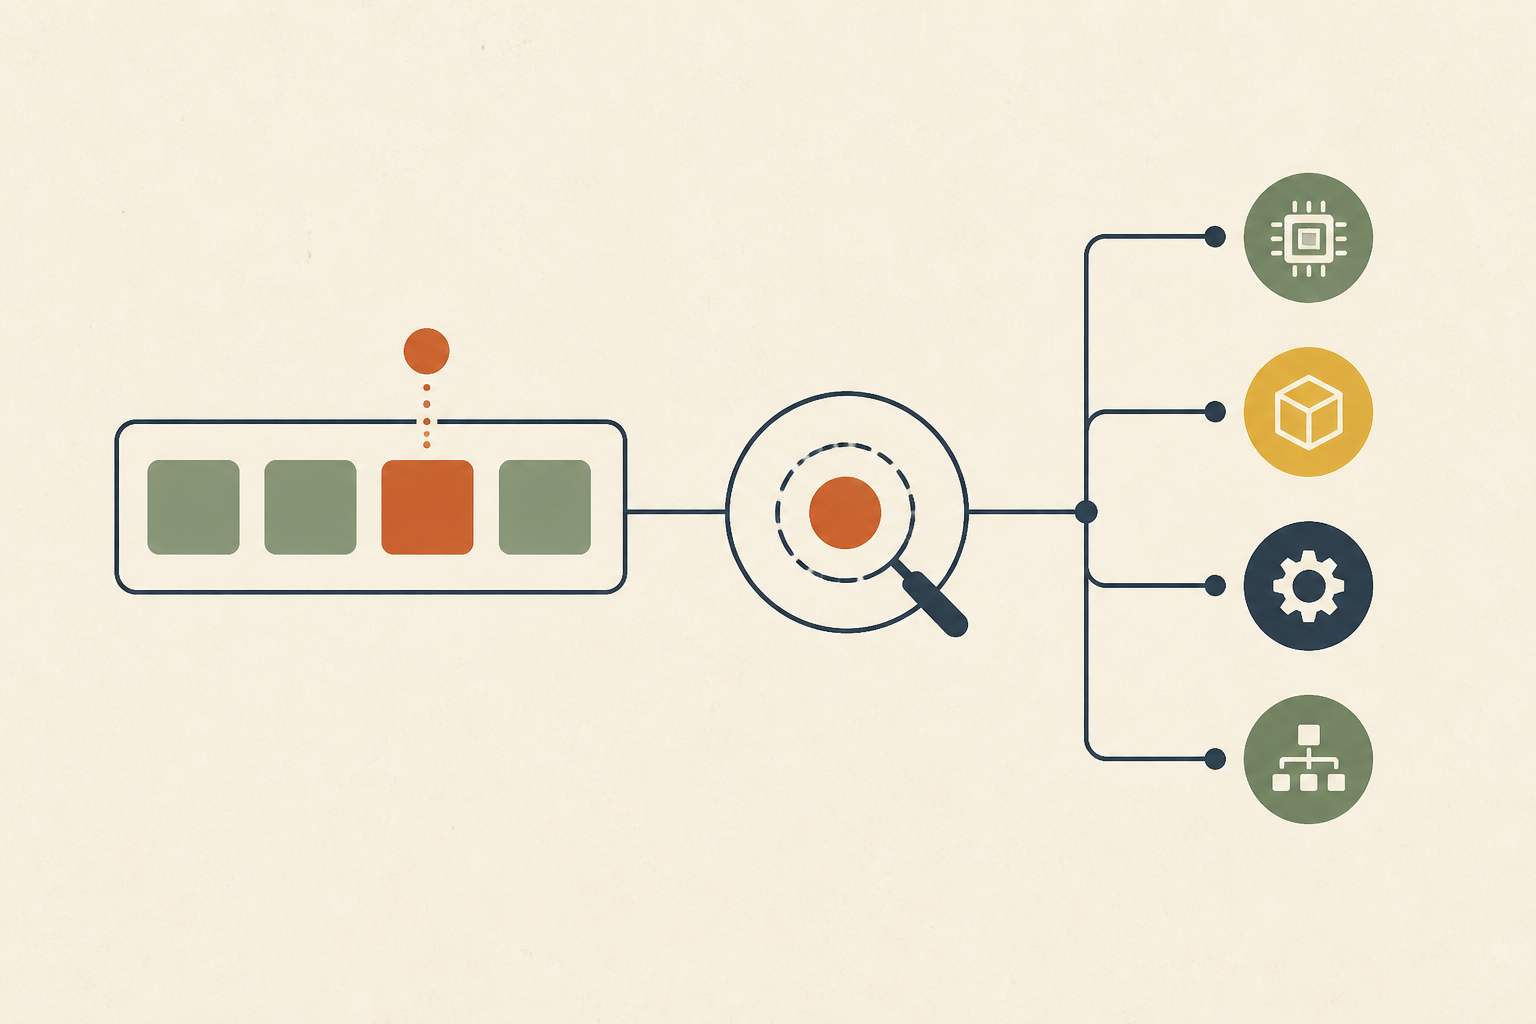
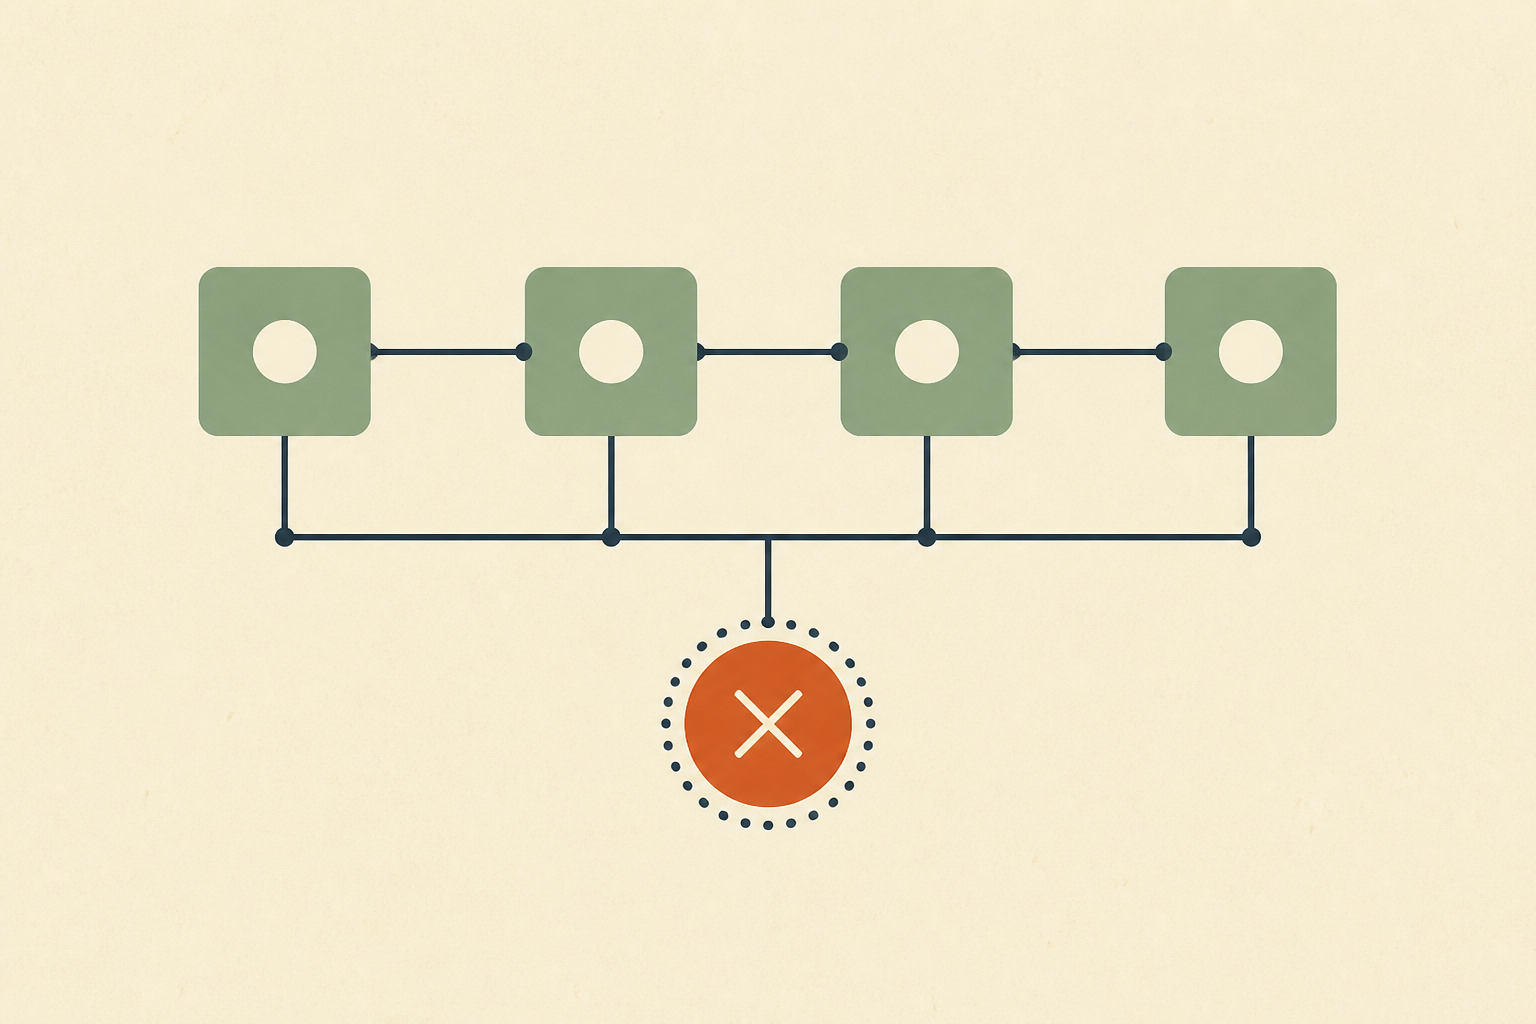
Stuck State Outlives the Outage at Railway and CircleCI
Railway and CircleCI both published July 2 postmortems where state captured during instability outlived the fix. Four stuck states and how to expire them.
Quick Answer
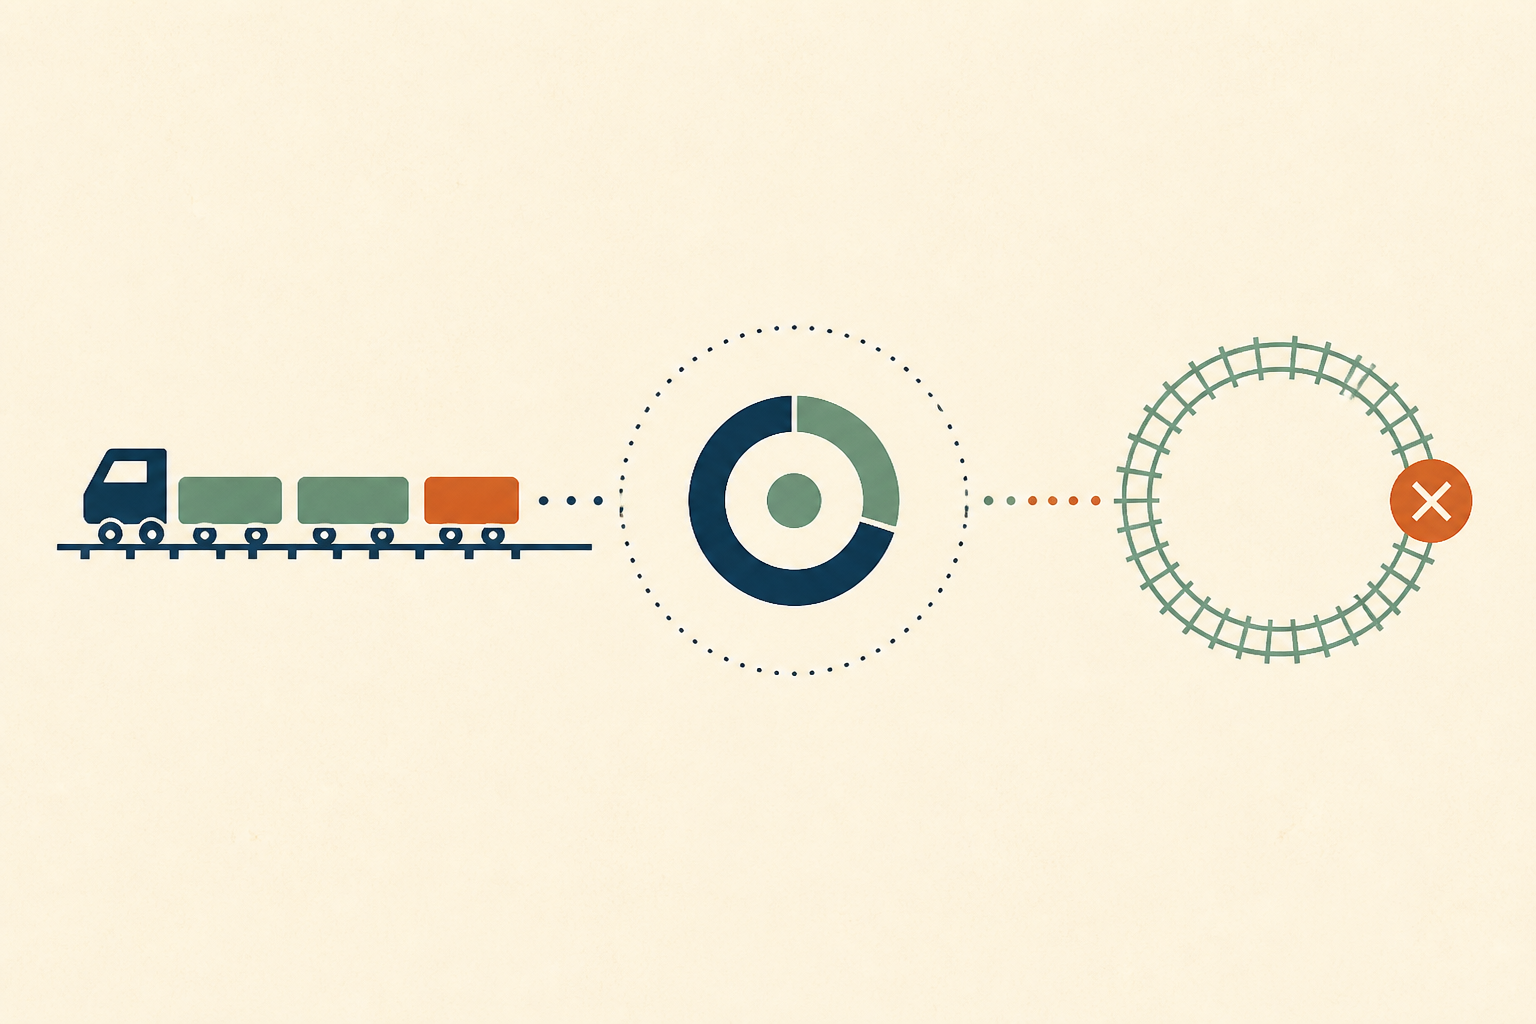
A system can pick up a bad path or a bad record during a short window of instability and keep it after the infrastructure recovers, a failure class called stuck state. On 2 July 2026 Railway's storage connections and mesh tunnels held wrong paths for hours after routing was fixed, and CircleCI's API connections had no timeout to release them. The fix is to re-assert state on purpose, not to wait for it.
Stuck state is what remains broken after the cause of an outage is gone. A connection, a tunnel, a thread or a status record captured something wrong while the system was unstable, and nothing in the design ever asks it to look again. The dashboards say recovered, and the users say otherwise.
We think it is the most useful way to read two postmortems published after 2 July 2026, one from Railway and one from CircleCI. Neither team used the phrase as a label for its own outage, but Railway's report states the pattern almost word for word, and CircleCI's shows the same gap from the application side.
In this post we cover the Railway timeline, the four stuck states the two reports describe, why monitoring reported health while they persisted, how to design re-assertion into a system, what an investigation should ask after any recovery, and when restarting everything is the wrong lesson.
Railway's Routing Recovered Hours Before Its Users Did
Railway's incident report for 2 July starts with an ordinary event. A carrier in the US backbone degraded, packet loss appeared at 07:44 UTC, and the team disconnected from that carrier at its US borders. Routing around a bad carrier is exactly what a multi-carrier design is for.
At 08:39 the team also disconnected a secondary carrier at one US East zone. That carrier turned out to be the only one still supplying the zone's default route, so the site had no stable route to the internet for roughly 20 minutes. Routing stabilized at 08:59 once the carrier was reconnected.
Most timelines would end there, but this Railway outage did not. Storage throughput in the zone stayed pinned at roughly a third of capacity from 09:00 until 10:45, private networking stayed degraded, and the incident was only marked resolved at 12:01. We count about three hours between the network being fixed and the platform being fixed, and every one of those hours belongs to state captured during the 20-minute window.
Four Stuck States in the Two July 2 Postmortems
Read side by side, the two reports describe four separate things that kept a bad value after its cause had cleared. We list them in the order a responder would meet them, because each one hid behind a different healthy signal.
1. Storage Connections Pinned to the Management Network
Each Railway server has a high-bandwidth fabric for production traffic and a slow management network for administrative access. When the fabric's default route vanished, the servers fell back to the management network, and a default Linux behavior let them answer for their storage addresses on it too. Storage connections opened during the window ran over a path with a small fraction of the fabric's capacity.
The report explains the mechanism in a sentence we think every SRE should keep in mind. "Network connections don't re-check their route once established; they keep using the path they started on until they close." The routing tables were correct again by 08:59. The connections built during the window never consulted them.
The effect was large and quiet. Two thirds of the servers in the zone sat waiting on disk while the cluster pushed its backlog through a narrow pipe. When the team terminated the stuck connections between 10:45 and 11:00, they reconnected over the right network within seconds, and I/O wait fell from 58% to under 5%.
2. Tunnels That Learned the Wrong Peer Address
Railway's private networking runs over encrypted tunnels, and each tunnel learns its peer's address from the packets it receives. During the disturbance, tunnel traffic briefly passed through a device that rewrites source addresses, and thousands of tunnels learned that device's address as their peer. They kept it after routing was rolled back.
The mesh only re-verifies peer addresses when its membership changes. An idle tunnel never sends the packet that would correct it, so a broken one stays broken until something forces it. At peak, roughly 20,000 host-to-host private links were blackholed, and the fix was a fleet-wide restart of the mesh agents at 11:49.
3. API Connections at CircleCI With No Timeout
CircleCI's post-incident report describes a different trigger on the same day. A maintenance deletion job and a burst of customer project deletions loaded a data service from 15:12 UTC, and the connections between the API layer and that service were not configured to time out slow responses.
Without a timeout, a slow dependency turns into a held thread, and held threads add up until the API stops answering anything. That is stuck state at the application layer. The resource is not lost to a crash; it is parked on a call that nothing will end, so capacity drains even though no component has failed outright.
The team scaled the affected services and cancelled a long-running maintenance task, and customer-facing services were back by 16:44. Their first follow-up was the missing piece, timeout protections on those connections.
4. Workflow Records Still Reporting Running
The quietest stuck state is a record. After the incident CircleCI found that a small number of workflows continued to report a running state, and said the records would be corrected over the following days. Billing was not affected, according to the report.
We include it because it shows the class is wider than networking. Any state machine that only moves forward on an event will hold its last value forever if the event is lost during an incident. The status is wrong, nothing re-derives it from the underlying jobs, and users see it before engineers do.
Why Stuck State Hides Behind Healthy Dashboards
Every stuck state above passed the checks that were looking at it. Railway's routing tables looked correct and the storage cluster reported healthy while throughput sat at a third of normal. Tunnels to reachable peers raise no errors when the peer address is wrong, and we see the same shape in most recoveries that drag on.
The reason is that health checks ask about components, and stuck state lives in the relationship between components. A connection can be open, a node can be up and a route can be correct, and the path the bytes actually take can still be the wrong one. Liveness answers "is it there", not "is it using the right thing".
Throughput makes it worse, because a pinned path rarely drops traffic to zero, so the graph shows a plateau rather than a cliff that reads as load. We have written before about detecting silent failures from outside the component, and stuck state is the clearest case for it. Only an expectation of normal, checked from outside, notices that normal never came back.
Re-Assert State on a Timer Instead of Trusting It
The structural lesson in both reports is that recovery has to be an action, not an assumption. Railway's own summary says nothing in the system re-asserted the correct state. We would design for that explicitly, with a few cheap mechanisms that make stuck state expire on its own.
- Cap connection age. gRPC's keepalive guide lists MAX_CONNECTION_AGE with a default of INT_MAX, which means a channel may live forever. Setting a finite age forces clients to reconnect and re-resolve, so a bad path lasts minutes, not hours.
- Time out every remote call. A missing connection timeout was the gap at CircleCI, and its first fix was a timeout between the API and its data service. An unbounded call is a stuck state waiting for a slow dependency.
- Re-verify learned addresses periodically. A tunnel or peer table that only refreshes on membership change needs a scheduled re-check, even when nothing looks wrong.
- Make fallback paths fail loudly. Railway plans to make a missing fabric route fail cleanly instead of silently taking a slower path, and to alert on management network utilization.
- Re-derive status from facts. A workflow state should be recomputable from the jobs underneath it, so a lost event cannot freeze it.
On multi-homed Linux hosts we would also review ARP behavior. The kernel's ip-sysctl documentation gives arp_ignore a default of 0, which replies for any local address configured on any interface. Railway did not name the setting it changed, so treat this as a place to look rather than its confirmed cause.
What to Ask After Any Recovery Before Closing the Incident
We think the most expensive moment in both incidents was the one where routing looked healthy and the investigation had to start again. Railway spent almost two hours between stable routing and finding connections sourced from management-network addresses. That search is a set of questions, and they can be asked on every recovery.
We would ask which connections, tunnels or sessions were opened during the unstable window, over which interface, and from which source addresses. Then we would ask if any state machine stopped advancing when the trigger ended, and if throughput is back to its pre-incident level or flat at a new, lower one. Stale connections rarely announce themselves, so each answer needs evidence rather than a dashboard glance.
Answering those quickly means reading host state, logs and the code paths that decide fallback behavior together, which is the job of root cause analysis done by an AI agent that investigates with evidence rather than by a dashboard. The same questions apply to provider incidents, and our notes on AWS outage postmortems show how often the long tail of an outage is recovery, not the original fault.
When Restarting Everything Is the Wrong Lesson
The obvious takeaway is "restart the fleet after any network event". We would resist it. Railway's fleet-wide mesh restart was the right fix on the day, but a blanket restart is itself a change, and recovery code is where some of the worst outages start, as the AT&T collapse of 1990 showed.
Stuck state is also not the explanation for every slow recovery. If throughput stays low because a backlog is draining, or because a cache is cold, forcing reconnections adds load to a system already catching up. We look for evidence that a specific path or record is wrong before resetting it, and a bounded, staged reconnection is usually safer than a big one.
Some state should persist on purpose. Sticky sessions, pinned leaders and cached credentials exist because re-establishing them costs something real. The goal is an expiry that matches the risk, not an expiry of zero.
Treat Every Recovery as Unproven Until Stuck State Is Ruled Out
Both July 2 postmortems end with fixes that make state expire, time out or fail loudly. We would add one habit for responders. When the trigger clears, ask what was created during the bad window and prove it has been replaced, because a recovered network says nothing about the connections it carries.
If you want the network side of this in more depth, our guide to connection reset by peer covers how to attribute a reset to the component that chose it. Operate runs dedicated AI agents inside your own infrastructure that investigate production issues through read-only adapters, and every finding cites its evidence.
Frequently Asked Questions
A stale connection is one that is still open but no longer reflects the right path, peer or server state. We see them after failovers, when a connection established during instability keeps its old route. The client thinks it is connected, so nothing reconnects until the connection is closed or times out.
Common causes are a failover that moves the primary while pooled connections still point at the old host, a network path that changed after the connection opened, and a firewall or load balancer silently dropping idle sessions. We usually find a pool with no maximum lifetime and no validation before reuse.
We close the affected connections and let clients reconnect, then stop it recurring. That means a maximum connection lifetime in the pool, a timeout on every remote call, validation before a pooled connection is reused, and alerts on traffic using an unexpected interface. Restarting everything works once but hides the cause.
It is a test a pool or driver runs before handing out a connection, such as a lightweight query or a socket probe, to confirm the server still answers. We find it catches dead connections well, but it cannot see a live connection that runs over the wrong path at a fraction of normal speed.
A carrier degradation and a follow-up routing change left one US East zone without a stable route for about 20 minutes. We read the longer impact as stuck state, since storage connections and tunnels created in that window kept bad paths until Railway terminated or restarted them, hours later.
About the author

Operate Team
The team behind Operate
Operate Team builds Operate, enterprise AI agents for production operations. Operate answers production questions from Slack and Microsoft Teams, investigates alerts, and reviews performance, security and cost. It finds the root cause with evidence and proposes a fix for an engineer to review, with controlled access to your systems.