Exit Code 137 Means SIGKILL, Not Always Out of Memory
Exit code 137 means a SIGKILL arrived, not always that memory ran out. The six senders, the evidence each leaves, and how to prove which one did it.
Quick Answer
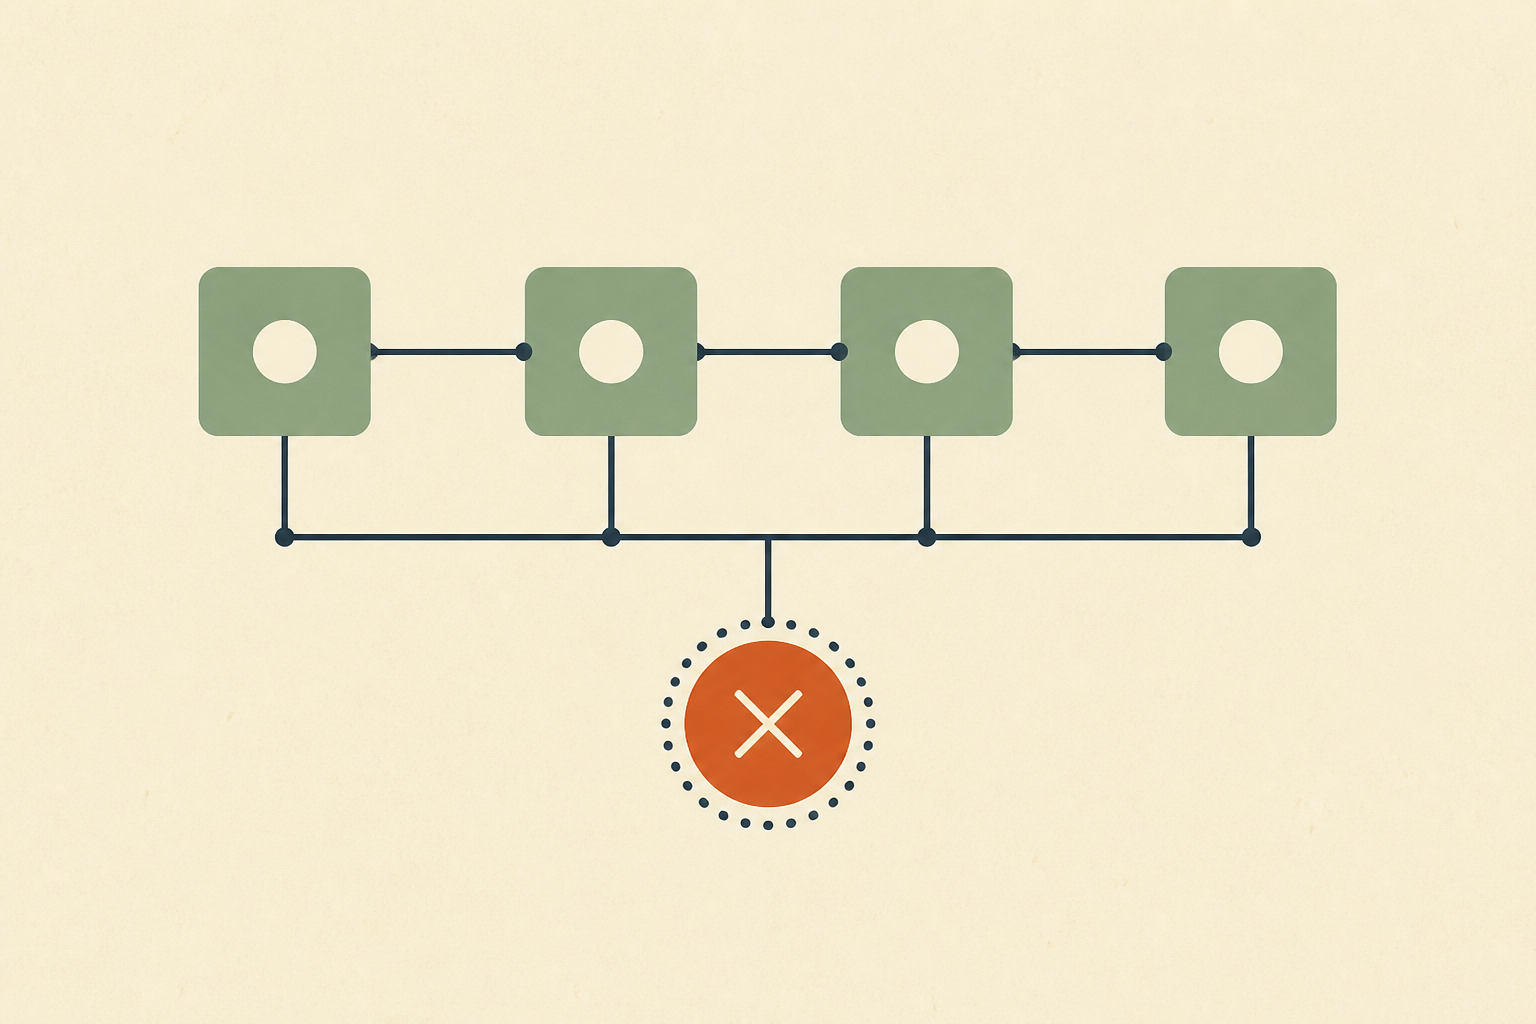
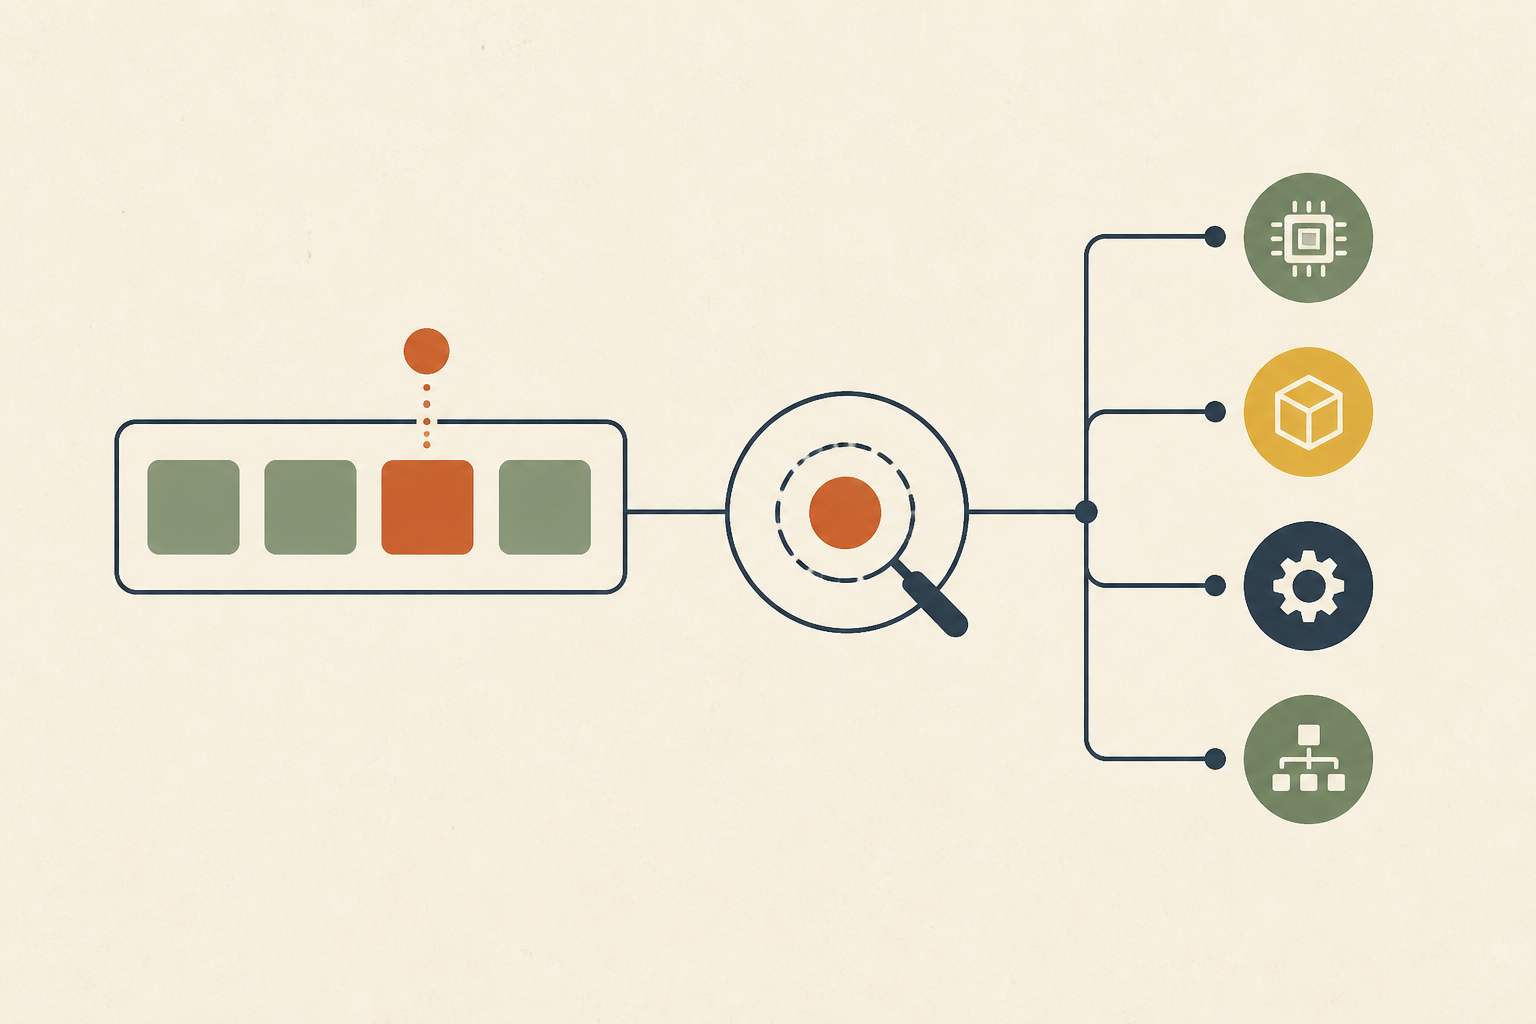
A process that ends with code 137 was killed by SIGKILL, signal 9, because shells report 128 plus the signal number. Memory is only one possible sender. A cgroup limit, the node's OOM killer, a kubelet eviction, an expired shutdown grace period, a failed probe and an external kill all end the same way. The evidence each one leaves, and how quickly it disappears, is what identifies the real killer.
Exit code 137 is the status a container or process reports when it was terminated by SIGKILL. Shells report a process killed by signal N as 128 plus N, and SIGKILL is signal 9. We treat the number as proof that something sent a hard kill, not as proof of why.
The reflex fix is to raise the memory limit, and it often does nothing. Several components use SIGKILL as their last resort, and only some of them have anything to do with memory.
In this post we cover what the number tells you, the six things that send the signal, the evidence each leaves, a procedure ordered by what it rules out fastest, and fixes matched to the cause rather than the code.
What Exit Code 137 Tells You and What It Does Not
The arithmetic is simple. A command killed by a signal gets an exit status above 128, and bash reports 128 plus the signal number, so 128 + 9 = 137.
The signal(7) man page is blunt about signal 9. "The signals SIGKILL and SIGSTOP cannot be caught, blocked, or ignored."
That is why the process leaves no last words. It cannot flush logs or run a shutdown hook, so the evidence has to come from whatever sent the signal. Its neighbors in the logs mean different things.
| Exit code | Signal | What it usually means |
|---|---|---|
| 137 | SIGKILL (9) |
Forced kill, no chance to clean up |
| 143 | SIGTERM (15) |
Polite request to stop, and the process exited |
| 139 | SIGSEGV (11) |
The process crashed on an invalid memory access |
One caveat applies. A program can call exit(137) on its own, so the number is strong evidence of a signal rather than absolute proof. In containers that case is rare, and we check it last.
Six Things That Send the SIGKILL Behind Exit Code 137
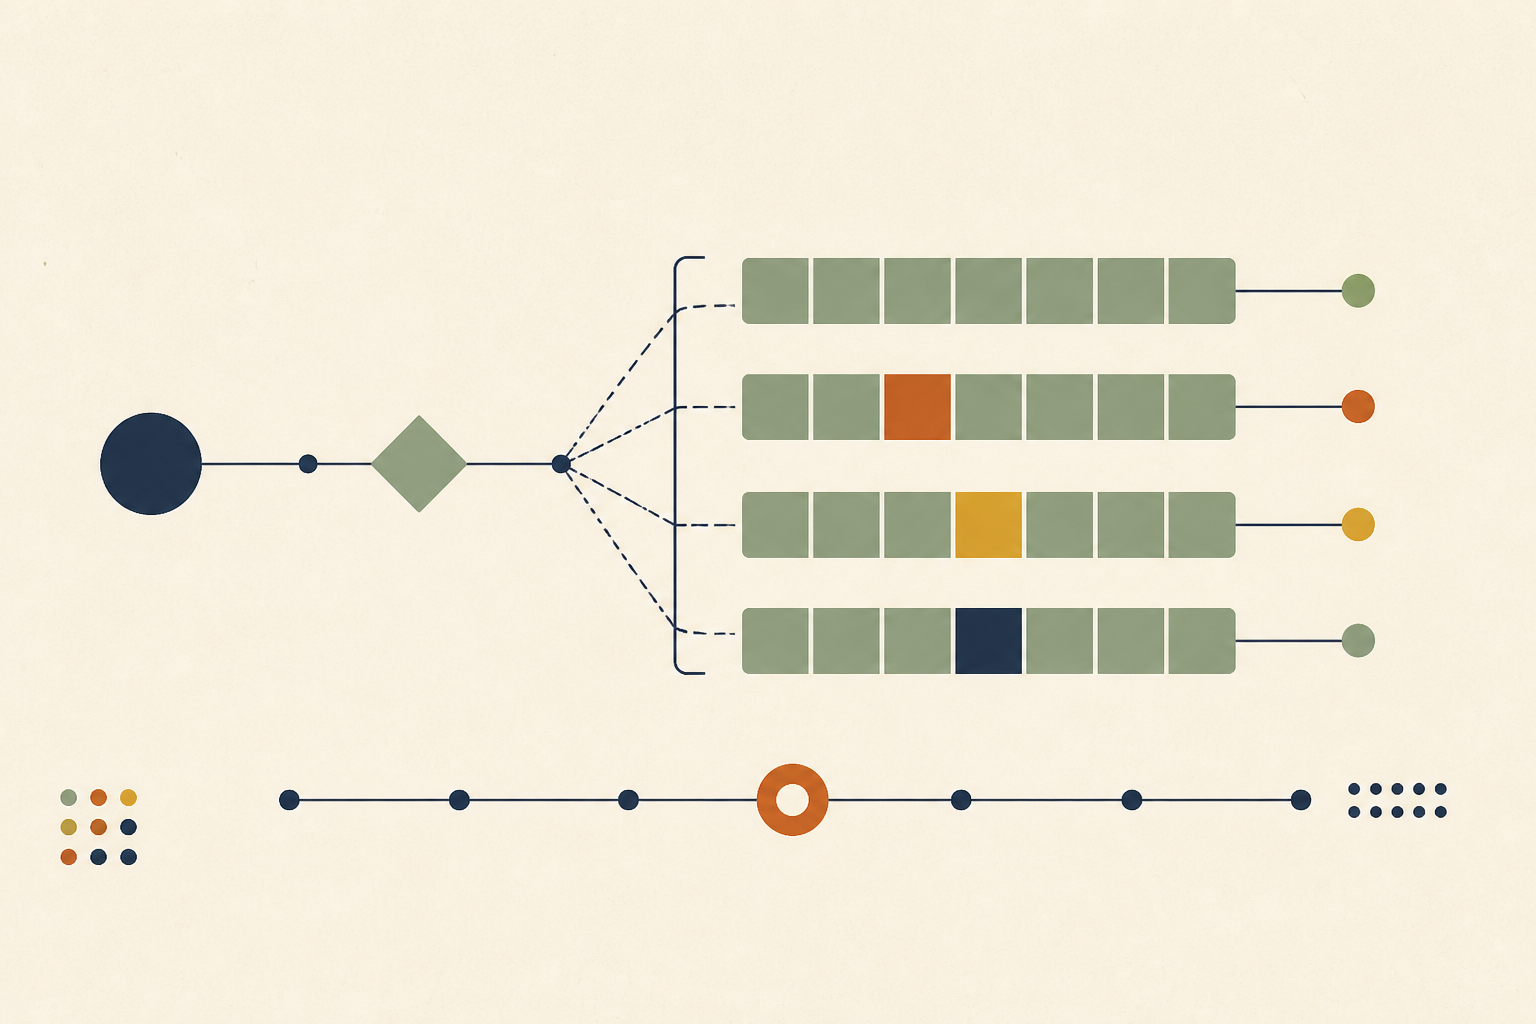
We sort every case into one of six senders. Two are about memory and four are not, which is why raising limits so often fails.
1. The Container's Own Memory Limit
When a container exceeds its memory limit, the kernel kills a process inside it. Kubernetes documents that memory limits are enforced by the kernel with out of memory (OOM) kills. This is the case people expect, and kubectl describe pod usually shows Reason: OOMKilled under the last state.
2. The Node Running Out of Memory
If the whole node runs short before the kubelet can reclaim memory, the kernel's OOM killer picks victims by score. The node-pressure eviction docs explain that the kubelet sets oom_score_adj by quality of service, with -997 for Guaranteed pods and 1000 for BestEffort pods. A container well under its own limit can still be chosen.
3. A Kubelet Eviction
Under memory or disk pressure, the kubelet evicts pods to protect the node. With a hard eviction threshold the kubelet uses a zero-second grace period, so the container gets SIGKILL immediately. The pod status shows Evicted, and an event records which resource ran short.
4. An Expired Shutdown Grace Period
On a normal stop, the container gets SIGTERM first and SIGKILL only if it is still running when the grace period ends. Kubernetes sets it with terminationGracePeriodSeconds, which defaults to 30 seconds per the pod lifecycle docs, and Docker defaults to 10 seconds for Linux containers. A slow shutdown handler turns every deploy into a stream of 137s.
5. A Failed Liveness or Startup Probe
When a probe fails, the kubelet kills the container and applies its restart policy. The kill follows the same SIGTERM then SIGKILL path, so a process that ignores SIGTERM exits with 137. Events show Unhealthy and the probe message, and probe design is its own topic, which we cover in liveness vs readiness probes.
6. An External Kill
A CI system cancelling a job that hit its time limit, a script running docker kill, or an operator typing kill -9 all produce 137. The container platform records nothing unusual, so the evidence lives in the CI logs or a shell history.
The table below is the one we keep open while working through a case.
| Sender | Main evidence | Where to look | How long it lasts |
|---|---|---|---|
| Container memory limit | Reason: OOMKilled |
kubectl describe pod or docker inspect |
Until the pod is replaced |
| Node OOM killer | Kernel OOM kill message | dmesg or the node's system log |
Until the ring buffer or log rotates |
| Kubelet eviction | Evicted status and event |
Pod status and Kubernetes events | Events default to one hour |
| Grace period expired | A stop request, then 137 instead of 143 | Events and application logs | Until the pod is replaced |
| Probe failure | Unhealthy events |
kubectl get events |
Events default to one hour |
| External kill | Timeout or cancel message | CI logs or audit logs | The CI retention period |
A Procedure That Rules Out the Fastest Causes First
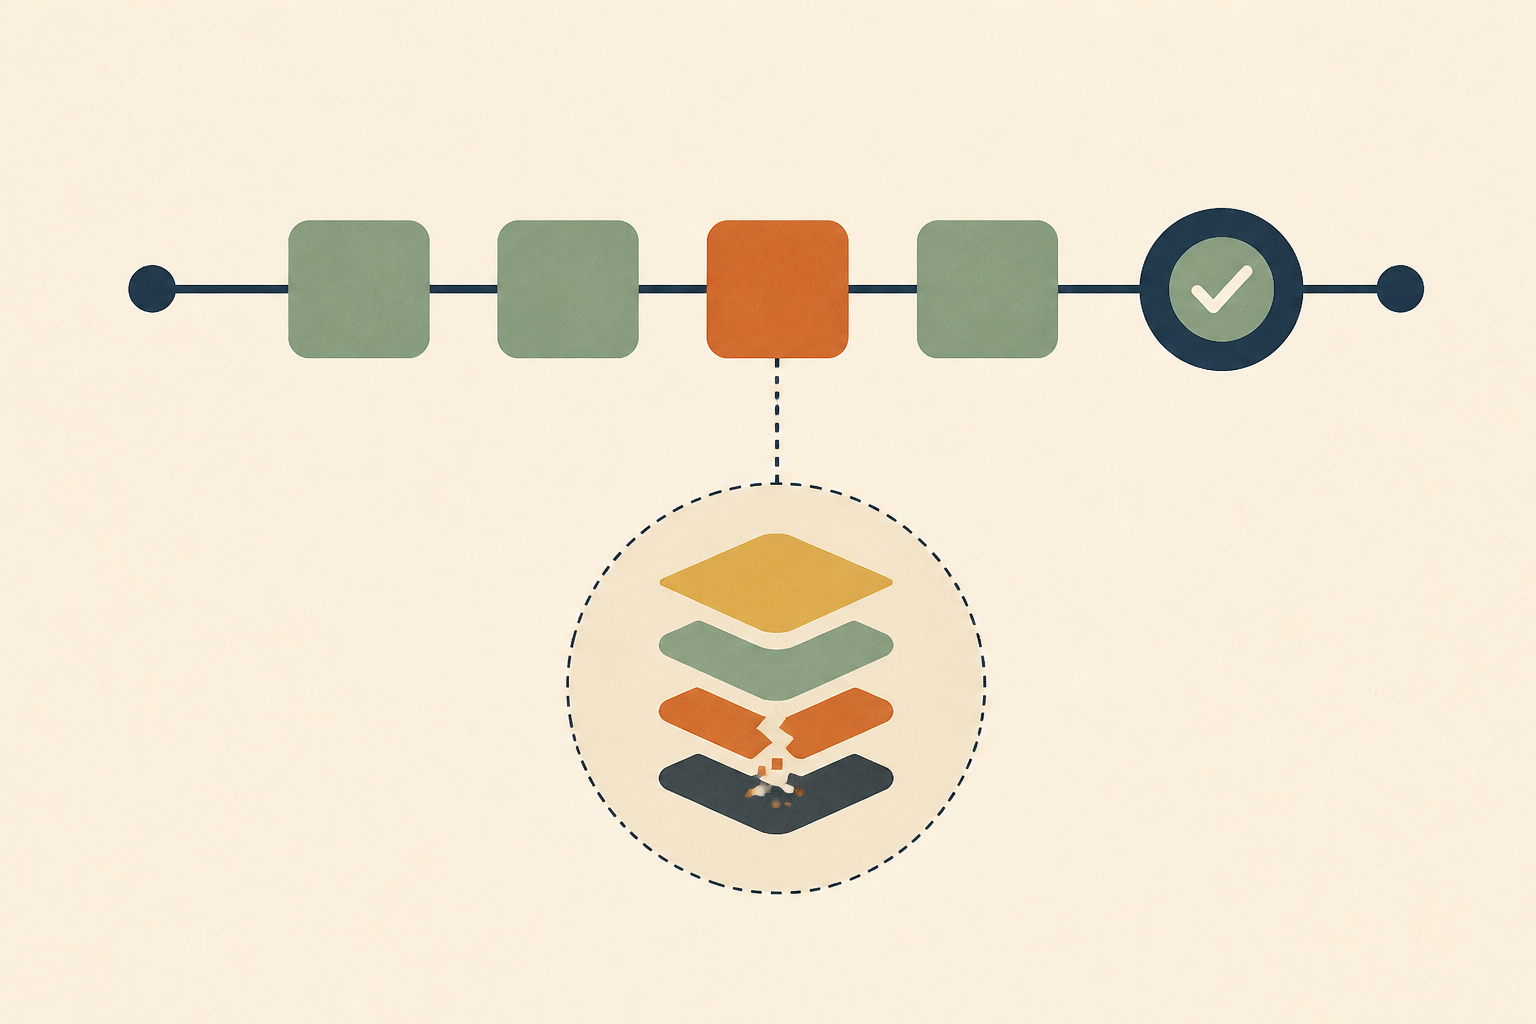
We work through the same five steps every time, because this part of root cause analysis rewards doing the cheap checks first.
- Anchor on the exact time of death and the container ID, since every later check needs a narrow window.
- Read the container's last state. If it says
OOMKilled, check the limit against real usage first. - Look for
Evicted,UnhealthyorKillingevents around that time, which explain why the platform chose to stop it. - If the platform is silent, read the node's kernel log for OOM kill messages at the same second.
- If the death happened in a build or job, check the CI system for a timeout or cancellation.
Kubernetes events are the evidence most often lost. The API server keeps them for one hour by default, so a 137 noticed the next morning has usually lost its explanation. Because the evidence expires, it helps to connect an investigator read-only to your logs and database before the next one arrives.
When the container keeps restarting, the same evidence feeds a restart loop, and we cover the order we check those in the CrashLoopBackOff triage order.
Why OOMKilled Is False So Often With Exit Code 137
A false OOMKilled flag does not mean memory is innocent. It means the runtime did not record an OOM kill for that container. We read it as a pointer toward the four non-memory senders first.
Evictions, expired grace periods, probe restarts and external kills all end in SIGKILL without an OOM event. So when we see 137 with the flag false, we check events and the stop timeline before touching memory settings.
Runtimes with their own memory managers add one more twist. A JVM that hits its own heap limit usually throws OutOfMemoryError and exits with a different code. A JVM that dies with 137 was usually stopped from outside, often because the container limit left too little room for memory outside the heap.
Fixes Matched to the Cause Instead of the Number
Each sender has its own fix, and applying the wrong one wastes a deploy. These are the ones we use.
- Container memory limit, which needs the limit raised to match measured peak usage, or the leak fixed.
- Node OOM, which needs requests that reflect real usage so the scheduler stops overpacking nodes.
- Eviction, which needs the disk or memory pressure behind it removed, such as runaway logs or ephemeral storage.
- Grace period, which needs a faster
SIGTERMhandler or a longer grace period for work that must finish. - Probe failure, which needs probe timing that matches startup and steady-state behavior.
- External kill, which needs the CI time limit raised or the job split.
Sizing requests well removes a whole class of node-level kills, and we wrote about that in rightsizing Kubernetes requests.
When Exit Code 137 Is Expected and Needs No Fix
Not every 137 is a problem to solve. Two cases are normal behavior.
• Work That Ignores SIGTERM on Purpose
Some batch processes and simple scripts never install a SIGTERM handler. They always end with 137 when stopped, and that is harmless if they hold no state that needs cleanup. Scheduled work cut off by a shutdown window is a different story, which we covered in thirty seconds before SIGKILL.
• An Operator or Pipeline Doing Its Job
A cancelled CI run or a deliberate kill -9 on a hung process produces 137 by design. We only investigate these when they repeat, since a repeating timeout usually points to a job that has outgrown its limit.
Prove the Sender Before You Change Exit Code 137 Settings
We would start with the time of death, then read the last state, the events and the node log in that order. Only change a setting once one sender clearly explains the evidence.
Handled that way, exit code 137 becomes a short investigation rather than a guess about memory. That is the kind of evidence trail Operate builds. It brings the evidence from your logs, databases and code together through read-only adapters, and proposes any code fix as a patch file an engineer reviews and applies.
Frequently Asked Questions
Sometimes, but not always. In our experience a memory limit or a node running out of memory explains many cases, yet evictions, expired grace periods, failed probes and manual kills produce the same code. We confirm memory by finding an OOMKilled reason or a kernel OOM message before changing any limit.
Exit code 143 means the process received SIGTERM and stopped on its own. Exit code 137 means it received SIGKILL and was stopped by force. We treat a 143 as a clean shutdown and a 137 after a stop request as a shutdown handler that took too long.
In Docker it means the container's main process was killed by SIGKILL. We see it after docker kill, after an out-of-memory kill, and after docker stop when the process ignores SIGTERM past the timeout, which defaults to 10 seconds for Linux containers. docker inspect shows whether OOM was recorded.
In Amazon ECS it means a task's container was killed with SIGKILL, usually after exceeding its memory or failing to stop in time. On Fargate the stopTimeout setting defaults to 30 seconds and can go up to 120. We read the task's stopped reason first, since it often names the cause.
We fix the sender, not the number. Raise the memory limit only when an OOM kill is confirmed. Otherwise speed up the shutdown handler, extend the grace period, retune probes, reduce node pressure, or raise a CI time limit, depending on which evidence explains the kill.
About the author

Operate Team
The team behind Operate
Operate Team builds Operate, enterprise AI agents for production operations. Operate answers production questions from Slack and Microsoft Teams, investigates alerts, and reviews performance, security and cost. It finds the root cause with evidence and proposes a fix for an engineer to review, with controlled access to your systems.