Connection Reset by Peer Means a Component Chose to Reset
Connection reset by peer means a TCP RST arrived. Learn the six components that send one, their timing signatures, and how to prove which one did.
Quick Answer
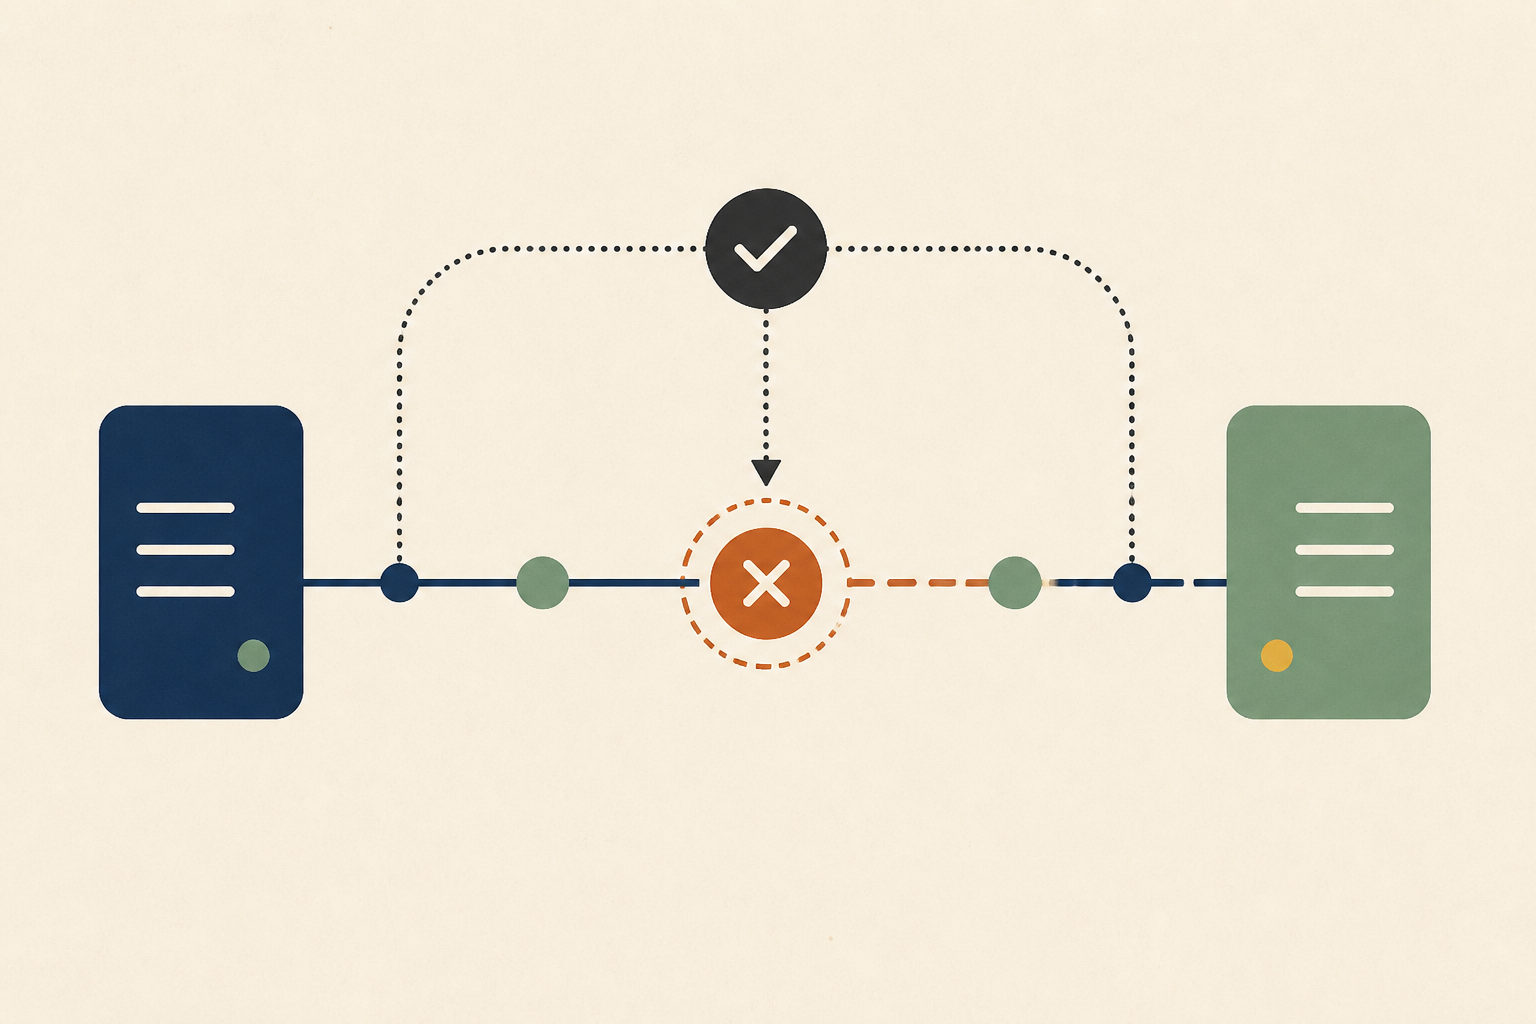
A TCP segment with the RST flag, arriving on an established socket, produces the connection reset by peer error. Six components can send it, the peer application, the peer host's kernel, a proxy or load balancer, a NAT or conntrack layer, a TLS endpoint and a service mesh sidecar. Timing usually points to the sender, and captures or platform metrics confirm it. Matching client idle windows to the shortest timeout on the path fixes most cases.
Connection reset by peer is the message a program reports when its kernel receives a TCP reset (RST) on a connection that was already established. On Linux it surfaces as ECONNRESET, errno 104. We read it as a decision some component on the path made, not as random network noise.
The hard part is that the component that sent the reset rarely logs it. Checking the other service's logs is often a dead end, because the reset may never have come from that service at all.
In this post we cover what the error records, how it differs from broken pipe, refused and timeout, the six components that can send an RST, how to attribute one with and without packet capture, and the fixes that hold.
What the Connection Reset by Peer Error Actually Records
The error records one fact. A segment with the RST bit set arrived for a socket your process had open, and the kernel tore the connection down and told your program. Any unread data in flight is discarded.
RFC 9293, the current TCP specification, states the rule plainly. "As a general rule, reset (RST) is sent whenever a segment arrives that apparently is not intended for the current connection." When a reset arrives on an established connection, the receiver aborts the connection and advises the user.
The same event has different names on each platform, which is why searches for it look so scattered. Google even suggests searches for an HTTP code, but we treat 104 as what it is, a POSIX errno on Linux and not an HTTP status.
| Platform | Name | Number |
|---|---|---|
| Linux | ECONNRESET |
104 |
| macOS | ECONNRESET |
54 |
| Windows | WSAECONNRESET |
10054 |
Proxies wrap it in their own words. In nginx error logs we usually see recv() failed (104: Connection reset by peer) followed by the action nginx was taking, such as reading the response header from upstream.
Reset, Broken Pipe, Refused and Timeout Are Four Different Signals
These four errors get lumped together as "network problems", but each one tells us something different about where the connection was when it died. We separate them before doing anything else.
| Error | Linux errno | When it appears | What it means |
|---|---|---|---|
| Connection reset by peer | ECONNRESET (104) |
On a read or write of an established connection | Something on the path sent an RST |
| Broken pipe | EPIPE (32) |
On a write | The connection was already closed or reset when we wrote |
| Connection refused | ECONNREFUSED (111) |
During the handshake | An RST answered our SYN, usually because nothing listens on the port |
| Connection timed out | ETIMEDOUT (110) |
During connect or while waiting | Nothing answered, often because packets were dropped |
The distinction matters for attribution. A refused connection points at the listener, a timeout points at drops, and a reset points at a component that actively chose to end a connection it did not recognize or no longer wanted.
Six Components Can Send the RST Behind Connection Reset by Peer
Every reset has exactly one sender. We find it fastest by matching the timing of the resets against the signature each sender leaves, then confirming with one piece of evidence.
1. The Peer Application
An application can force an abortive close. On Windows the error text for WSAECONNRESET lists a hard close set through the SO_LINGER socket option as one cause. RFC 2525 also says a TCP should send an RST when an application closes a connection while received data is still unread.
The signature is a reset at a request boundary, often right after the server finishes a response while the client is still sending. The evidence lives in the peer's code, such as a handler that closes the socket early on an error path.
2. The Peer Host's Kernel
If a segment arrives for a connection the host does not know, the kernel answers with an RST. That happens after a process crash, a container restart, or when a client reuses a pooled connection that the server already closed.
The signature is a reset on the first write after an idle gap or after a restart. The evidence is a restart timestamp that lines up, or ss -tan on the peer showing no matching established socket.
3. A Proxy or Load Balancer Idle Timeout
Proxies track connections and give up on idle ones. AWS documents this behavior for its Network Load Balancer. If a client or target sends data after the idle timeout, the client receives a TCP RST, and the default TCP idle timeout is 350 seconds, adjustable from 60 to 6,000.
nginx closes idle connections too, with a default of 75 seconds for client keepalives and 60 seconds for upstream keepalive connections. The close itself is graceful, but a client that writes into that closed socket gets a reset from the proxy host.
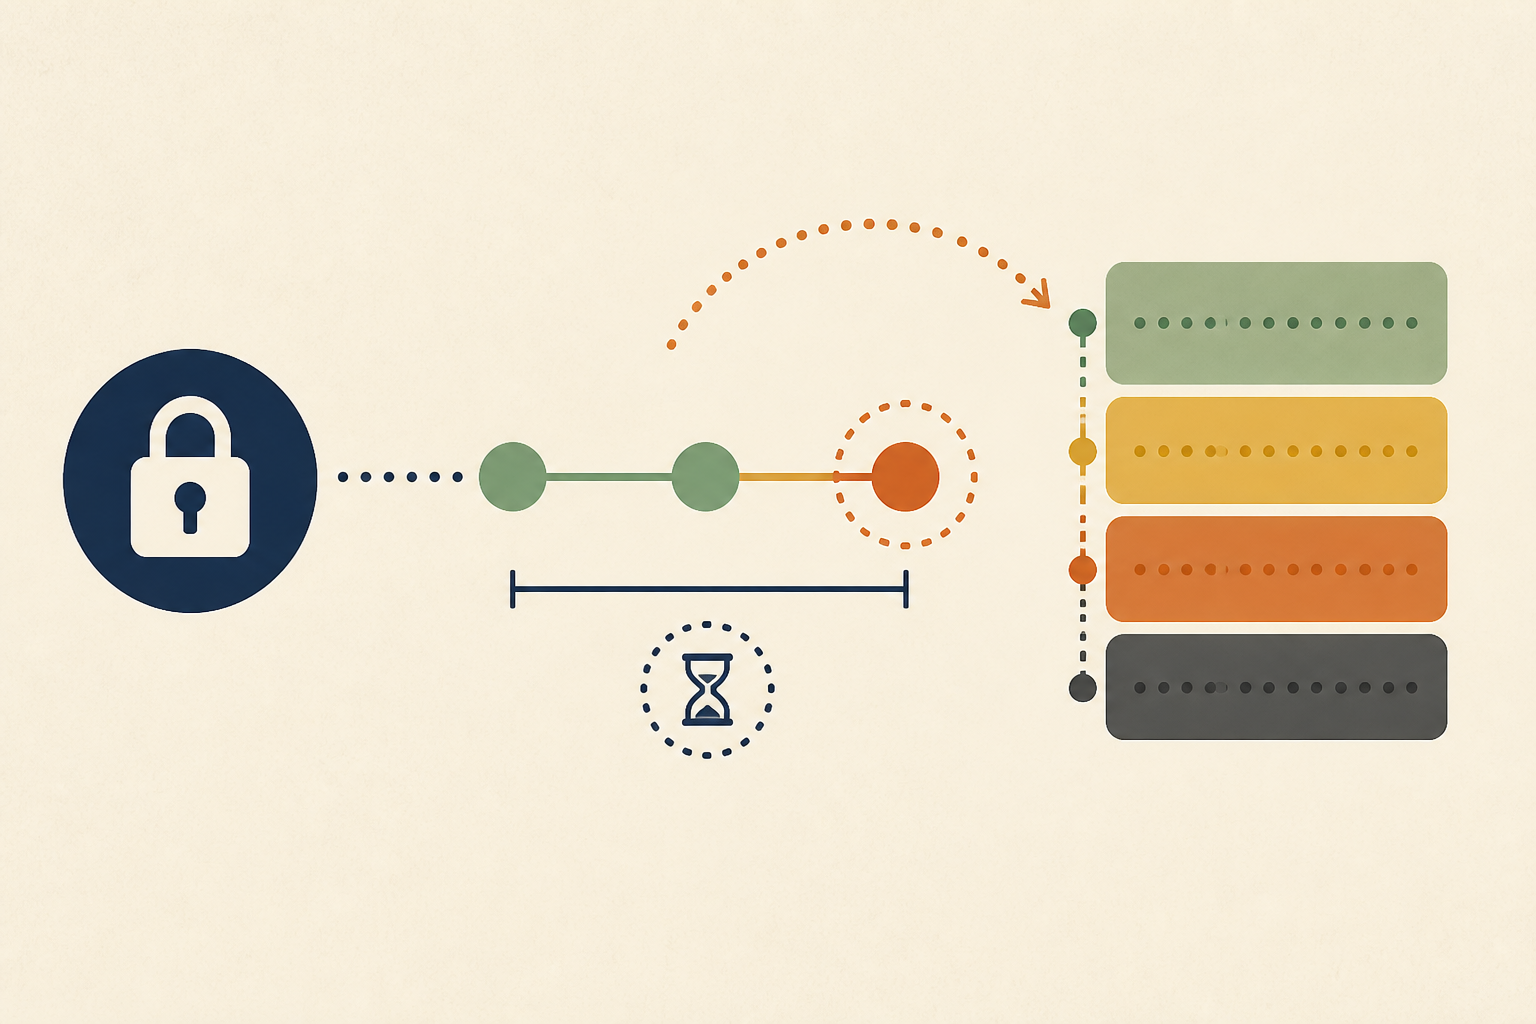
The signature is a round number. When the connection age at reset clusters at exactly 60 or 350 seconds, we compare it with every configured idle timeout on the path.
4. NAT and Conntrack
With kube-proxy in iptables mode, Kubernetes nodes rewrite service traffic through conntrack. The Kubernetes project documented a reset this layer causes in kube-proxy subtleties. A returning packet that conntrack marks INVALID, for example because it falls outside the TCP window, is forwarded without its address rewritten, so the client pod does not recognize it and resets the connection.
The signature is intermittent resets on pod-to-service traffic, often on large or long transfers. A full conntrack table behaves differently, because the kernel logs nf_conntrack: table full, dropping packet and drops it, which shows up as timeouts rather than resets.
5. A TLS Endpoint Rejecting the Handshake
Some TLS terminators abort a handshake they reject with a TCP reset rather than a TLS alert. The signature is a reset before the first byte of any response, and nginx records the context as SSL handshaking to upstream.
When the handshake stalls instead of resetting, it is a different problem with its own method, which we cover in TLS handshake timeout is almost never TLS.
6. A Service Mesh Sidecar
In a mesh, the sidecar owns the connection lifecycle on both sides of the application. When a pod shuts down, the sidecar can stop before the application finishes its last requests, and callers see resets at the edge of a rollout.
The signature is resets clustered around deploys and node drains. Envoy's access log carries the evidence in its response flags, where UC means upstream connection termination and DC means downstream connection termination.
How to Attribute a Reset When You Can Capture Packets
A packet capture settles attribution faster than anything else. We capture only resets, on both ends if we can, so the file stays small enough to read.
tcpdump -nn -i any 'tcp[tcpflags] & tcp-rst != 0' -w resets.pcap
Then we compare the reset with the normal traffic from the same address. A reset whose IP TTL differs from the TTL of that peer's data packets probably came from a box in the middle rather than from the peer. It is a strong hint, not proof, because some middleboxes copy TTLs.
Capturing at both ends answers the question directly. If the client sees an RST that the server never sent, something between them generated it.
How to Attribute a Reset When You Cannot Capture Packets
Managed load balancers, gateways and serverless platforms rarely let us run tcpdump. In those cases we attribute by exclusion, using three habits.
- Plot how old each connection was when it reset. A spike at one exact age is almost always an idle timeout.
- Reproduce on a canary by holding a connection idle just past the suspected timeout, then writing to it.
- Read the platform's own signals, such as Envoy response flags, conntrack counters on the node, or load balancer connection metrics.
| Observed pattern | Probable sender | Confirming test |
|---|---|---|
| Resets at one exact connection age | Proxy or load balancer idle timeout | Shorten the client pool idle time below that age |
| Resets clustered around rollouts | Mesh sidecar or pod shutdown order | Check drain and preStop ordering, read Envoy flags |
| Reset before any response byte | TLS endpoint | Repeat the handshake with curl -v and the same SNI |
| Intermittent on pod-to-service traffic | Conntrack INVALID packets | Look for INVALID packets in conntrack statistics |
| First write after a peer restart | Peer host kernel | Match reset times to restart times |
Public issue trackers are full of these threads, which is one reason we publish root cause analysis on public GitHub issues. Reading how maintainers closed them teaches the signatures faster than any table.
When the Reset Is Correct and the Client Must Change
A reset is not always a bug to remove. A proxy enforcing an idle limit, a server shedding load, or a firewall blocking a port is doing its job, and we usually fix the client instead.
Raising the proxy's timeout from 60 to 120 seconds often just moves the reset. The durable fix is making the client's pool drop idle connections before the shortest idle timeout on the path does.
Retries need the same care. RFC 9110 is explicit that "A client SHOULD NOT automatically retry a request with a non-idempotent method unless it has some means to know that the request semantics are actually idempotent." A reset that lands after the server processed a payment but before the reply arrived turns a blind retry into a double charge, which is why the HTTP specification also says a proxy must not retry such requests.
Fixes That Hold Once You Know Who Sent the RST
Once the sender is known, the fix is usually one setting. These are the ones we reach for most often.
- Set the client pool's idle timeout below the shortest idle timeout of every proxy, load balancer and NAT on the path.
- Enable TCP keepalive where the platform honors it, since AWS notes keepalive packets restart the NLB idle timeout.
- Order pod shutdown so the sidecar drains after the application, and give the endpoint time to leave the load balancer first.
- On Kubernetes nodes hit by INVALID packets, drop them with an iptables rule or relax conntrack's window check, as the kube-proxy write-up describes.
- Retry only idempotent requests, or carry an idempotency key the server checks.
Timers interact across hops, and we wrote down how to line them up in every hop has a timer. Retries that multiply under resets have their own diagnosis in measure the amplification factor first, and a similar naming problem appears in context deadline exceeded names the caller.
Treat Every Connection Reset by Peer as a Lead to One Component
We would start every investigation the same way. Classify the error correctly, plot connection age at reset, and match the pattern to one of the six senders before touching a timeout.
Treated that way, connection reset by peer stops being a network blip and becomes a lead to one component and one setting. That evidence-first habit is what Operate automates. It brings the evidence from your logs, databases and code together through read-only adapters to find the component behind a failure, and proposes any code fix as a patch file an engineer reviews and applies.
Frequently Asked Questions
A TCP reset from something on the path. In our experience the usual senders are an idle timeout on a load balancer or proxy, a peer process that restarted and forgot the connection, or a sidecar shutting down during a rollout. Less often it is conntrack on a Kubernetes node or a rejected TLS handshake.
Find the sender first, then change one setting. We most often shorten the client connection pool's idle timeout below the proxy's, add TCP keepalive, or fix pod shutdown ordering. Raising server timeouts usually only delays the reset, and retrying non-idempotent requests can duplicate work.
Errno 104 is Linux's number for ECONNRESET, the error a socket call returns after the kernel receives a TCP reset. It is not an HTTP status. We see the same condition as errno 54 on macOS and 10054, WSAECONNRESET, on Windows.
We use two methods in test environments. An iptables rule with REJECT --reject-with tcp-reset on the server port makes the host answer with a reset. A small server that sets SO_LINGER to zero and closes the socket mid-request produces an abortive close from the application itself.
We prevent most resets by keeping every client idle window shorter than the timeouts in front of it, and by draining connections before pods stop. Health checks that remove instances before shutdown help too. For the resets that remain, idempotent retries with backoff keep users from seeing them.
About the author

Operate Team
The team behind Operate
Operate Team builds Operate, a self-hosted AI SRE that reads your logs, databases and code to find the root cause of production issues with evidence, then drafts the fix as a patch for an engineer to review. Operate runs in your own infrastructure with read-only access to your systems.