Context Deadline Exceeded Names the Service That Gave Up, Not the One That Was Slow
Context deadline exceeded names the caller that gave up, not the slow hop. A cross stack method for finding which service was actually slow, and when to raise the timeout.
Context Deadline Exceeded Names the Service That Gave Up, Not the One That Was Slow
TL;DR: The error context deadline exceeded is emitted by the caller that ran out of patience, identifying the service that stopped waiting rather than the one that was slow. To find the root cause, you must trace the deadline budget from the edge to identify which hop exhausted the remaining time.
The error is a receipt, not a diagnosis
When you see context deadline exceeded in your logs, you are looking at a receipt. It is a formal notification that a specific component reached its time limit and cancelled an operation. Crucially, this string names the service that gave up, which is almost never the service that was slow.
The error message itself is structurally silent on the three things you need most during an incident:
- Which hop was slow: The caller cancelled, but which dependency failed to respond?
- Which layer set the deadline: Was it the local function, a middleware, or an upstream load balancer?
- The nature of the failure: Did the dependency degrade, or was the "deadline budget" always too small, finally exposed by a slight increase in load?
Where the deadline came from
The context deadline exceeded error is ubiquitous in Go-based systems, Kubernetes environments, and gRPC-heavy architectures because deadlines are designed to propagate. If a top-level request has a 30-second timeout, every subsequent call in that chain inherits what remains of that time.
Understanding the origin requires mapping the surface where you saw the error to the most likely deadline source:
| Surface | Likely Deadline Source | Default Behavior |
|---|---|---|
| Go HTTP Client | context.WithTimeout at call site |
None (Wait forever) |
| Kubernetes Liveness Probe | failureThreshold * periodSeconds |
1s timeoutSeconds |
| Docker / Registry Pull | DOCKER_CLIENT_TIMEOUT or Daemon config |
Often 60s |
| Helm Upgrade | --wait flag or --timeout |
5m 0s |
| gRPC Call | grpc-timeout header propagation |
Inherited from parent |
| Prometheus | scrape_timeout in config |
10s |
The deadline budget
There is a piece of arithmetic that operators rarely write down: the deadline budget. A 5-second deadline set at the edge is not 5 seconds at hop three.
Consider this chain:
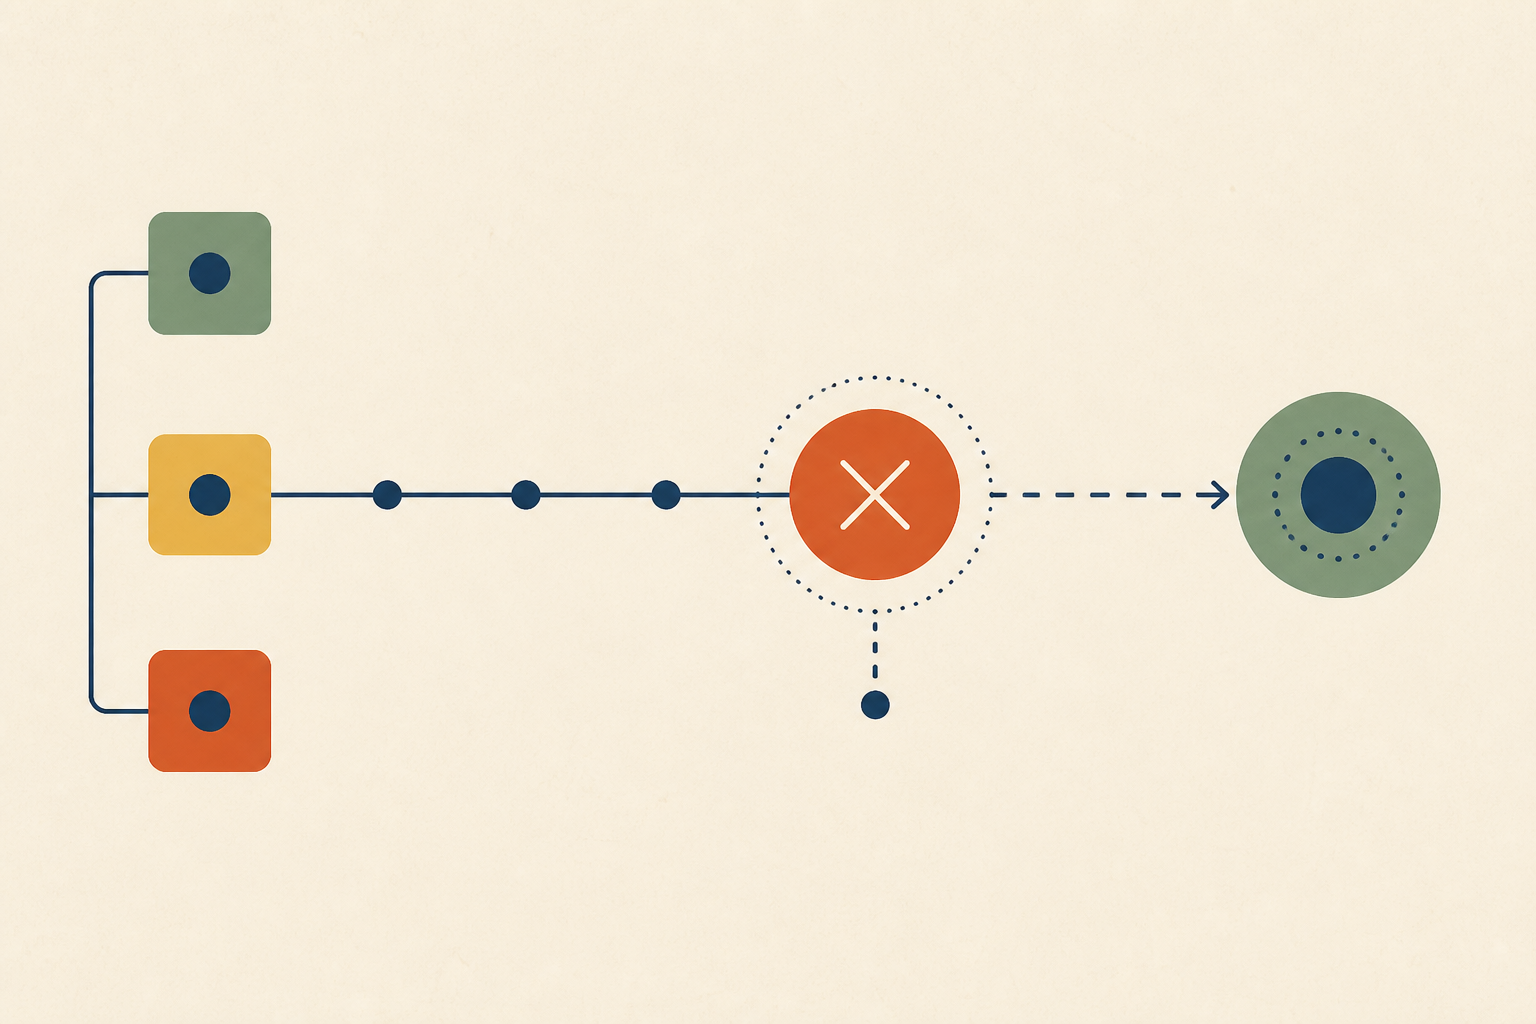
- Edge Gateway: Sets a 5s deadline and calls Service A.
- Service A: Spends 800ms processing business logic, then calls Service B.
- Service B: Inherits a 4.2s deadline. It attempts a call to Service C, which fails. Service B retries twice with a 300ms backoff.
- Service C: By the time the final retry reaches Service C, the budget is nearly exhausted.
In this scenario, Service B will log context deadline exceeded. The tragedy of retries under an inherited deadline is that they are often guaranteed failures. Each subsequent attempt has less time than the one before it. The correct instrumentation is not just measuring duration, but logging the remaining budget on entry via ctx.Deadline().
Key Takeaway: The service logging the error is rarely the root cause; it is simply the point where the inherited deadline budget hit zero.
Four hypotheses, in the order that narrows fastest
When triaging context deadline exceeded kubernetes or go context deadline exceeded errors, test these four hypotheses in order:
- The budget was always too tight: The operation’s p99 latency has always hovered near the deadline. A minor shift in traffic distribution pushed it over the edge.
- A dependency genuinely degraded: Check the "self-time" of downstream spans. If a database query that usually takes 10ms is now taking 200ms, it is eating the budget of every caller upstream.
- The call is hung, not slow: This occurs during TCP connection stalls, DNS resolution deadlocks, or proxy buffer saturation. The call isn't "taking time"—it's waiting for a resource that isn't responding.
- Clock skew: According to Temporal documentation, clock skew between distributed components can cause absolute deadlines to fire prematurely. This is the "ghost" cause that often evades standard latency monitoring.
Finding the slow hop when you have tracing
Distributed tracing is the fastest way to solve this. However, many engineers fall into the "cancellation trap." In a trace, a cancelled parent span will automatically cancel all its children. This creates a "wall of red" where every service reports a failure.
The rule: Ignore the cancelled status; look for the sibling with the long self-time. The span that was active and consuming time just before the cancellation signal propagated is your primary suspect.
Finding the slow hop when you do not have tracing
If you lack tracing, you must rely on logs. The minimum viable instrumentation to survive the next incident involves logging three specific metrics for every outbound call:
- Operation name and target.
- Start time and total duration.
- Remaining budget on entry.
If Service A logs that it entered with 500ms remaining and the call to Service B took 501ms, you have found your bottleneck. Without the "budget on entry" log, you cannot distinguish between "Service B was slow" and "Service A took too long to call B."
The surface specific appendix
Raising a timeout is often a mask, not a fix. Here is how to interpret common specific errors:
- Kubernetes Liveness/Readiness Probes: Raising
timeoutSecondsmasks slow application startup or thread pool starvation. - Docker Context Deadline Exceeded: Usually indicates MTU mismatches or registry throttling rather than a slow download.
- ArgoCD / Helm: Often triggered by
gitoperations on massive monorepos or slow manifest generation via Kustomize/Helm templates. - Prometheus Scrape Timeout: According to SigNoz, this is frequently caused by high-cardinality metrics slowing down the
/metricsendpoint, not network latency.
When raising the timeout is the correct fix
Raising the timeout is the correct fix only when the deadline was set arbitrarily (e.g., a default 30s) and the operation—such as a large data export or a complex LLM agent chain—is performing within its expected p99 but naturally requires more time.
A defensible deadline should reflect a real service level objective (SLO), not a round number typed into a config file by a developer three years ago.
One page triage card
If you are currently in an incident, follow this path:
- Identify the Entry Point: Where was the request initiated? (ALB, Cron, CLI?)
- Check the Budget: What was the total time allowed at the edge?
- Locate the First 'Exceeded' Log: The service logging this is your Observer.
- Identify the Dependency: Who was the Observer trying to call? This is your Suspect.
- Differentiate Slow vs. Hung: Did the Suspect respond with any data before the timeout? If no, check for connection pool exhaustion or DNS issues. If yes, check Suspect's internal latency/resource usage.
Why this matters
Locating the slow hop in a distributed system is fundamentally a data correlation problem. You need the trace, the deploy history, the dependency's own latency, and the configuration that set the deadline. Usually, this correlation happens manually in an engineer's head at 2 AM.
At Operate, we believe this correlation shouldn't depend on human memory. Operate's context and root cause stages automatically join these disparate signals to identify the slow hop before a human is even paged. When the investigation points to a timeout value or a retry policy that needs adjustment, Operate drafts the fix as a PR for your team to review and merge.
Sources & further reading
- According to Uptrace, the Go
contextpackage is the standard mechanism for cancellation signals across the stack. - According to Temporal, checking for clock skew is a critical first step in distributed environments.
- According to HashiCorp, Vault and other Go-based tools use these errors to prevent resource exhaustion during dependency failure.