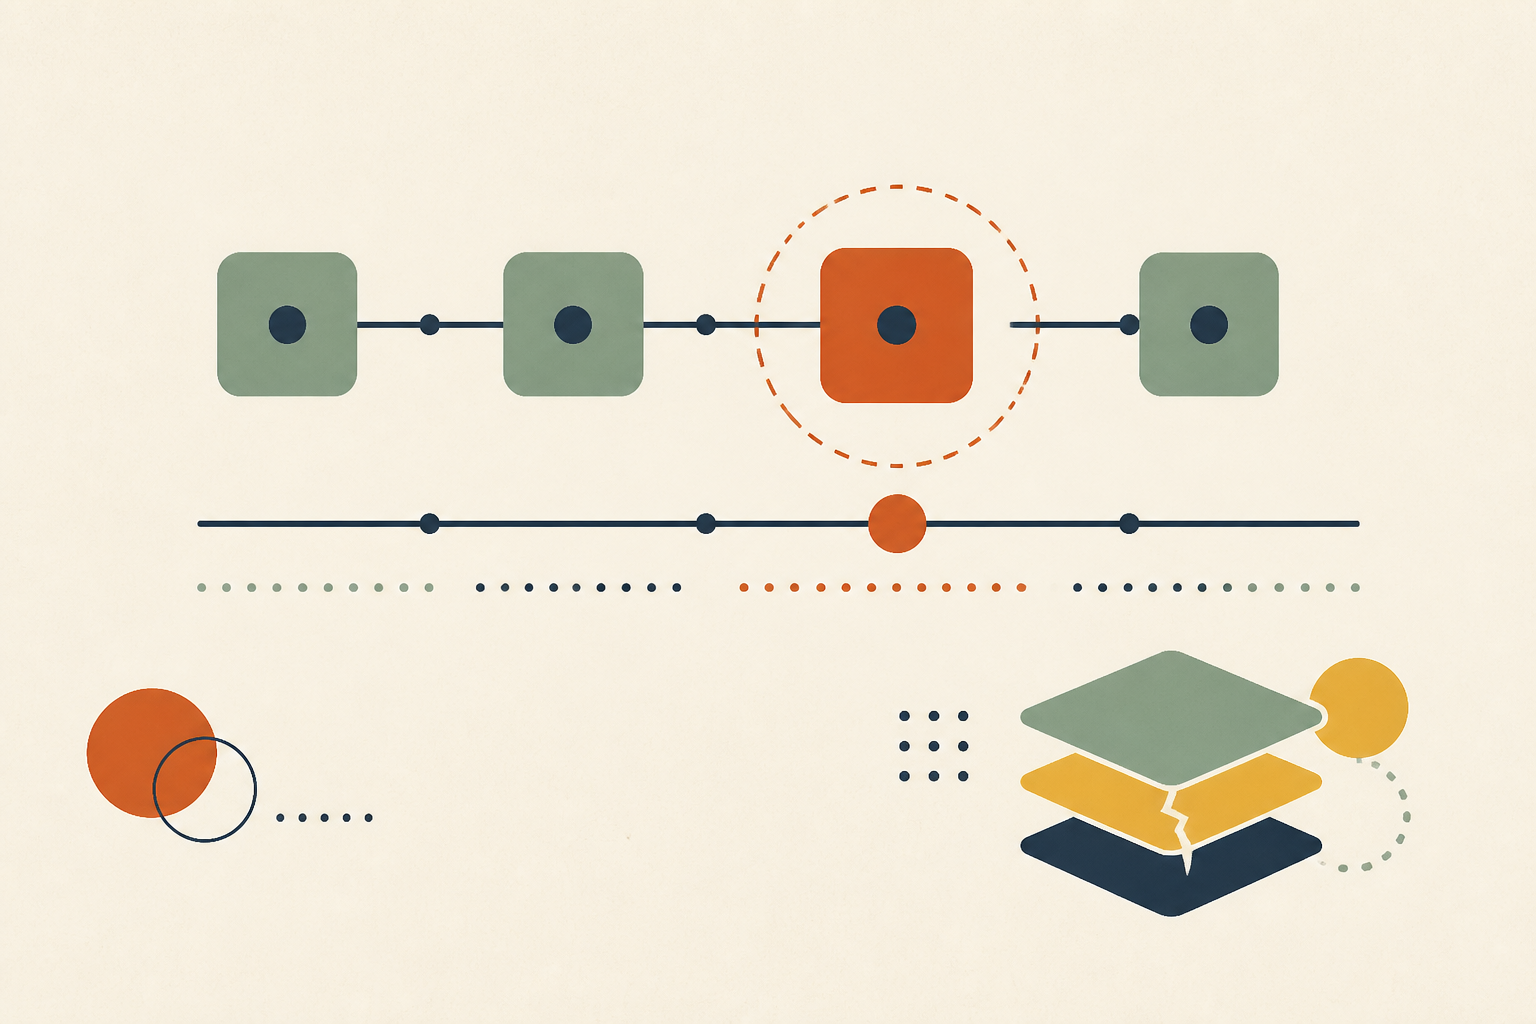
Every Hop Has a Timer. Write Them Down in Order and You Will Usually Find One Inverted.
TL;DR: A 504 gateway timeout occurs when a server acting as a gateway or proxy fails to receive a timely response from an upstream server. It identifies the specific hop whose timer expired, but it does not necessarily name the component that was slow; resolving it requires auditing the entire request path for timeout inversions.
The 504 names the hop that gave up, not the hop that was slow
A common misconception is that a 504 gateway timeout means the application is broken. In reality, a 504 is a statement about a gateway’s own internal configuration. It means the gateway reached its pre-defined limit for waiting on a response.
According to [MDN Web Docs], a 504 status code is returned when a server acting as a proxy cannot get a response in time to satisfy its own timeout budget. This distinguishes it from a 502 Bad Gateway, which implies an invalid response or a connection refusal. When you see a 504, you aren’t looking at a diagnosis; you are looking at the moment a specific timer in your stack hit zero.
Draw your path before you touch anything
Modern production environments are no longer simple "client-to-server" connections. A typical request path often includes a CDN, a WAF, a cloud load balancer (like an AWS ALB), an ingress controller (like Nginx), a service mesh sidecar (like Envoy), the application server (Spring Boot, FastAPI, or Node.js), and finally the database.
Each of these stages—or "hops"—has its own independent timeout configuration. Most engineers have between six and ten of these timers running simultaneously for every single request. If you haven't written them down in a single list, you likely have a latent 504 waiting to trigger.
The ladder: every timer, its default, and the doc that defines it
To understand what causes 504 gateway timeout events in your specific stack, you must audit the "ladder" of defaults. The following table represents the most common defaults across distributed paths.
| Hop | Directive / Setting | Default Value | Evidence / Source |
|---|---|---|---|
| Cloudflare | Error 524 (Timeout) | 125 seconds | [Cloudflare Docs] |
| AWS CloudFront | Origin Response Timeout | 30 seconds | [AWS CloudFront Docs] |
| AWS ALB | Idle Timeout | 60 seconds | [AWS ELB Docs] |
| AWS ELB | Target Connection Timeout | 10 seconds | [AWS ELB Docs] |
| Nginx Ingress | proxy_read_timeout |
60 seconds | [Nginx.org] |
| Nginx Ingress | proxy_connect_timeout |
60 seconds | [Nginx.org] |
| Apache | ProxyTimeout / Timeout |
60 seconds | [Apache.org] |
| HAProxy | timeout server |
(No default) | [HAProxy.org] |
| PHP-FPM | request_terminate_timeout |
0 (Unlimited) | [PHP.net] |
| Postgres | statement_timeout |
0 (Unlimited) | [PostgreSQL.org] |
Key Takeaway: A 504 is often caused by an unset inner timeout (like a database statement timeout) allowing a process to run longer than the outer gateway's budget.
The invariant
For your system to behave predictably, you must satisfy a single checkable invariant: For any adjacent pair of hops, the outer budget must exceed the inner budget multiplied by the number of attempts (retries) the outer hop will make, plus the connection time.
When this invariant is violated, you encounter two canonical patterns:
- Inversion: Your application has a 75-second timeout, but your ALB has a 60-second idle timeout. The ALB returns a 504 while the app is still processing. The client sees a failure, but the work continues.
- Equality: Both the proxy and the app are set to exactly 60 seconds. They enter a race condition where the emitting hop is a coin flip, making logs nearly impossible to correlate across deploys.
What happens to the work the gateway abandoned
The most dangerous part of a 504 gateway timeout the server didn't respond in time error is what happens to the "orphaned" work. Timing out is not the same as cancelling.
When an outer timer (like a CDN) fires, the inner hop (the application) usually has no idea the client has left. It continues to hold the database connection and occupy the CPU. If the client or proxy then retries the request, that retry arrives at a backend that is still occupied by the first, abandoned request. This leads to [retry-storm-amplification-factor], where an inverted ladder converts a single slow dependency into a cascading queue that never drains.
Reading a 504 you did not expect
If you are wondering how to fix a 504 gateway timeout during an active incident, follow this diagnostic order:
- Duration Fingerprint: Does the 504 arrive in exactly 30, 60, or 120 seconds? If the response time is a round number, it almost certainly matches a vendor default in your ladder.
- Header Attribution: Inspect the headers.
Server,Via,X-Amzn-Trace-Id,CF-Ray, andX-Envoy-Upstream-Service-Timeare signatures that tell you exactly which box generated the error. - Emitting Hop Logs: Check the logs of the hop identified in step two. Do not start with application logs; the application often believes the request was successful because it finished after the gateway gave up.
- Upstream Latency: Only after identifying the timer should you look at the upstream (e.g., a slow database query) that caused the delay.
The audit, as a checklist you can run this week
To prevent future incidents, conduct a configuration audit:
- Enumerate every hop in your request path.
- Read the effective value at each hop (check the actual running config, not just the template).
- Check the invariant for each pair.
- Fix inversions by lowering the inner budget. It is always better for the failure to be fast, attributed, and cheap than slow and anonymous.
- Set a timeout on every unbounded process, especially the database
statement_timeout.
When a 504 is not yours
Is a 504 gateway timeout my fault? If you are a visitor, the answer is usually no; it is a server-side configuration issue. For engineers, if the emitting hop is a managed provider (like an AWS API Gateway), and their status page is green, check your egress. A 504 from a provider often means your own service failed to respond to them within their hard-coded limits.
Why this matters now
The number of timers in the standard request path has doubled in recent years with the rise of service meshes and WAFs. Because this "ladder" crosses infrastructure, code, and database boundaries, it rarely has a single owner. This lack of ownership leads to "operational debt"—configurations that work fine under normal load but collapse into retry storms the moment latency spikes.
Operate addresses this by reading the configuration across the entire path, from the load balancer to the database. When it detects a timeout inversion or an unbounded budget, it identifies the risk before it causes an incident. Operate then proposes the fix as a PR for a human to review, ensuring that your timeout ladder remains monotonic and your system stays resilient.
Sources & further reading
- According to [AWS ELB Docs], the default idle timeout for an Application Load Balancer is 60 seconds.
- According to [Nginx.org], the
proxy_read_timeoutdirective defaults to 60 seconds and defines the time between two successive read operations. - According to [Cloudflare Docs], a 524 error is a Cloudflare-specific version of a 504 that occurs when the origin does not respond within 125 seconds.
- According to [MDN Web Docs], the 504 Gateway Timeout error is an HTTP standard status code indicating a communication failure between servers.