Dashboards Green but System Down Comes From Edge Failures
When every health check passes and users still fail, the fault is usually between components. Four edge classes with a documented cause, and a path test.
Quick Answer
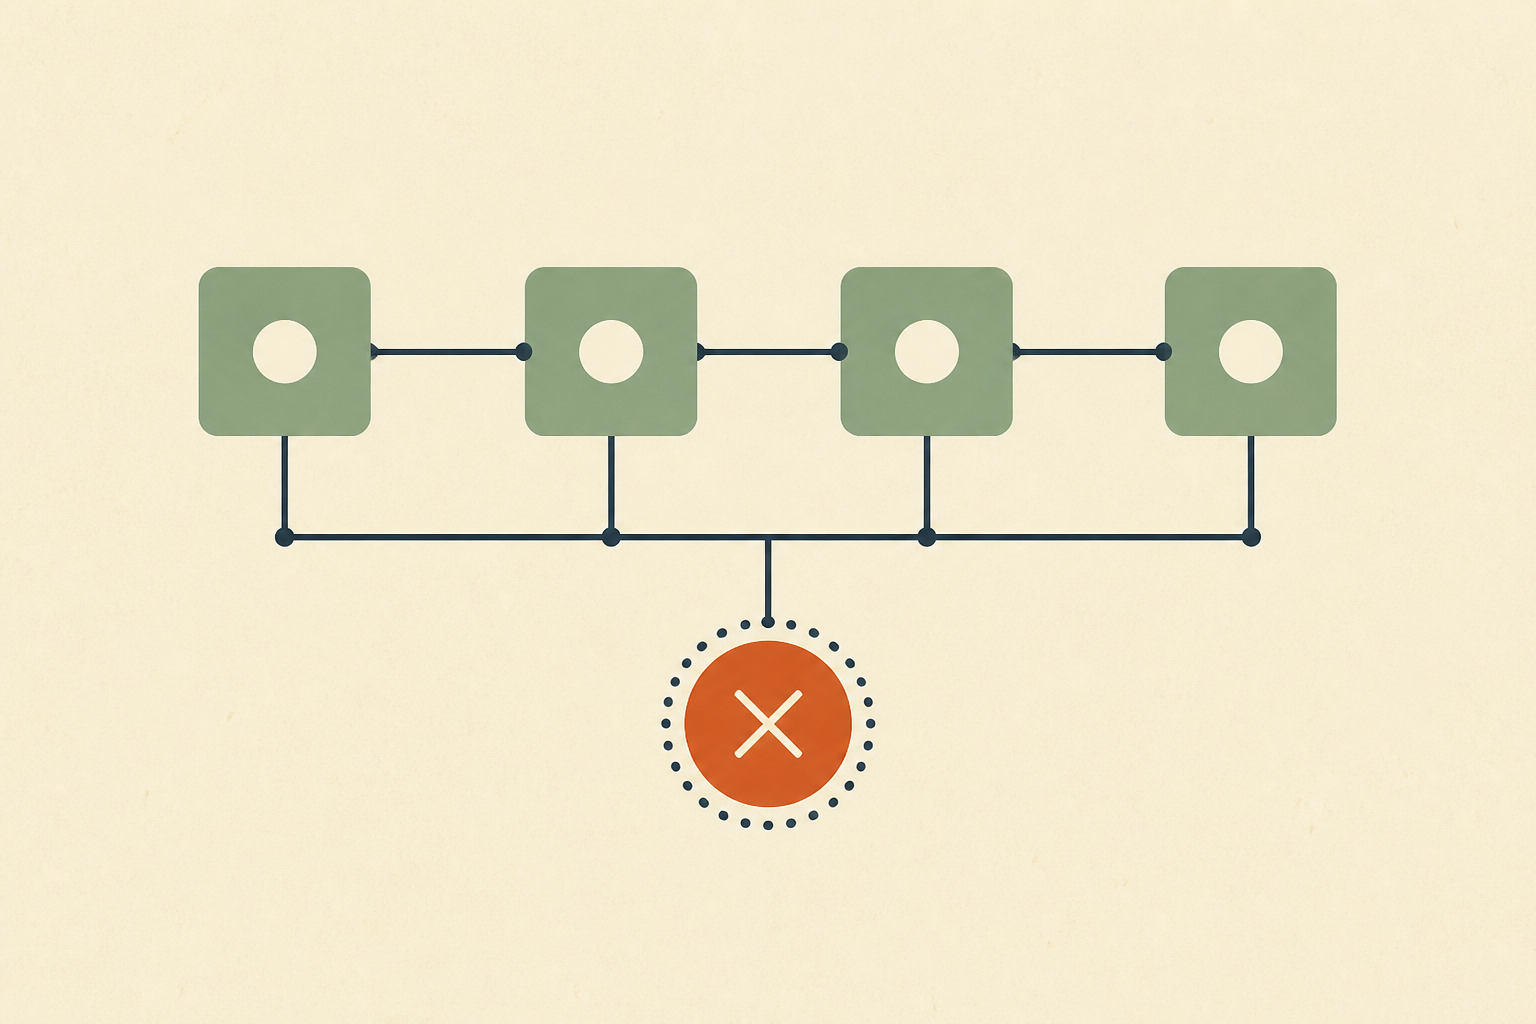
When every component reports healthy and users still fail, the fault usually sits between components, in a policy, a protocol timer or a type conversion that no per-service check exercises. Health checks prove that a process answers its own probe, not that a caller can reach it with a real request. Trace one real request along the path, compare declared and effective configuration, then add path-level checks.
Dashboards green but system down is the most disorienting page an on-call engineer gets. Every pod is ready, every database is up, and yet the support channel says the product is unusable.
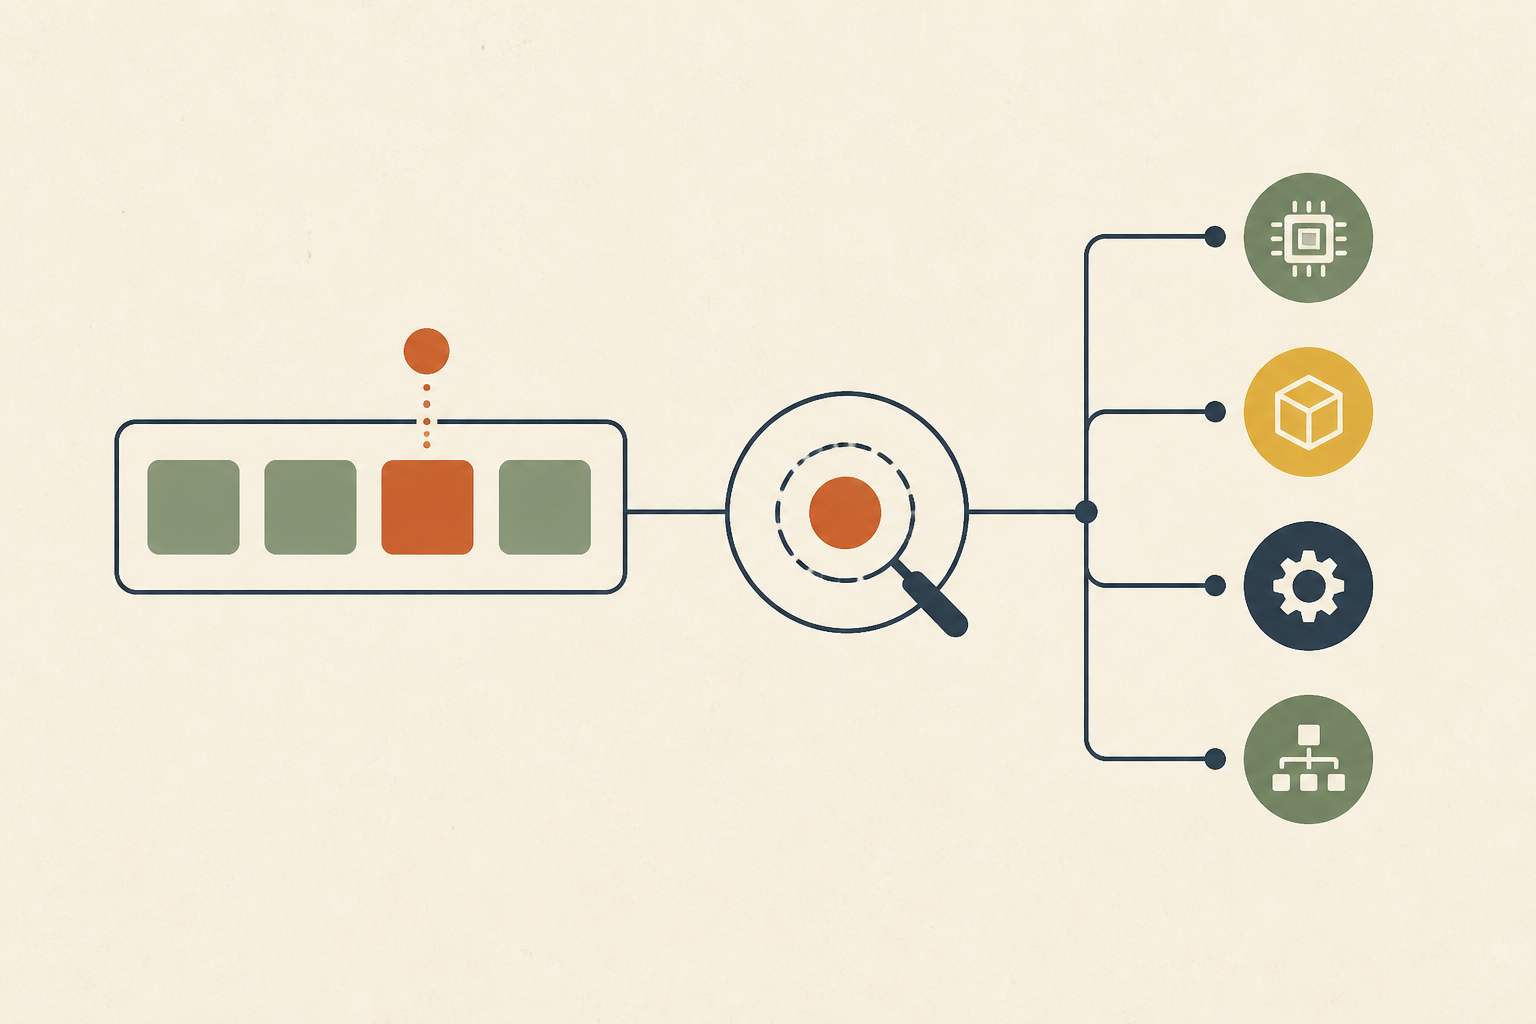
We use the term edge failure for the cause, meaning a fault in the connection, policy or translation between two healthy components. It is our shorthand, not an industry standard, and it helps because it points the search at the space between the boxes.
This post explains why green checks mislead, describes four edge classes with a documented mechanism for each, gives a protocol for testing the path, and says when green dashboards are simply telling the truth.
A Green Check Proves the Component, Not the Path
Per-component checks are existence proofs. In Kubernetes, a readiness probe tells the platform when a container is ready to accept traffic, and a pod that fails it is removed from the Service's endpoints. A pod that passes is simply ready by its own measure.
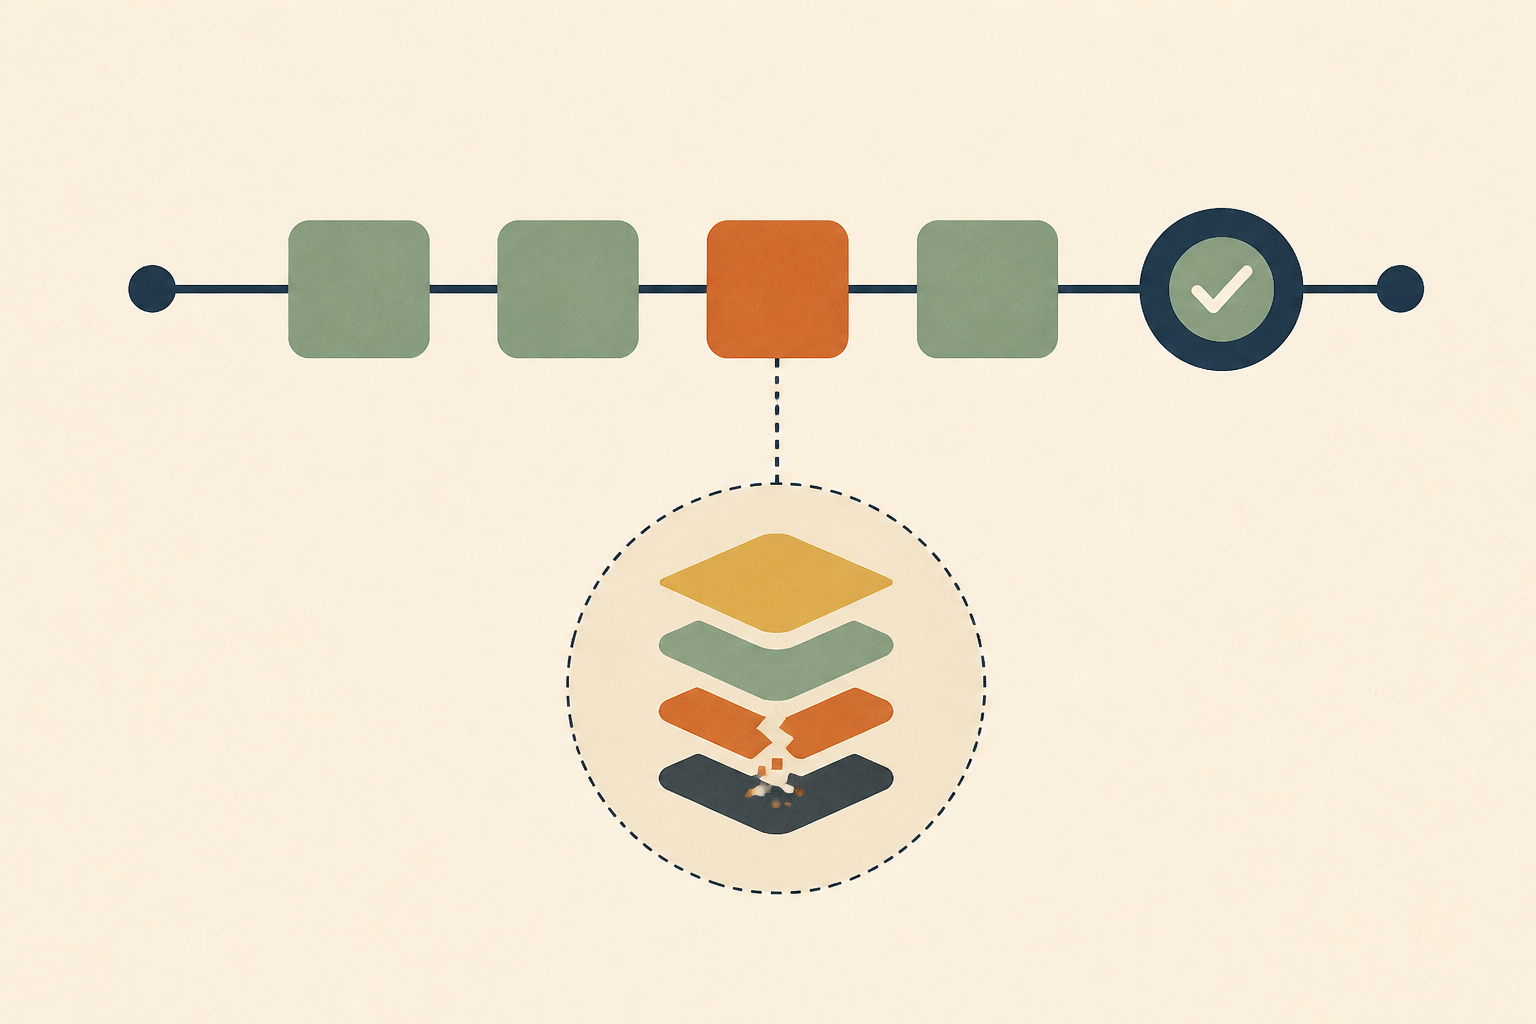
Nothing in that mechanism asks whether a particular caller can reach the pod. The probe runs from the kubelet's side, and in our reading it never exercises the network path, the caller's identity or the protocol a real client uses. Monitoring that aggregates probe results therefore reports a healthy node while the edge is broken.
The same holds for other layers. A load balancer target group can be healthy while a security group blocks the caller, and a database can answer a ping while a specific query shape has become far slower. In each case the node has no awareness of the gap around it.
Dashboards Green but System Down Has Four Common Edge Classes
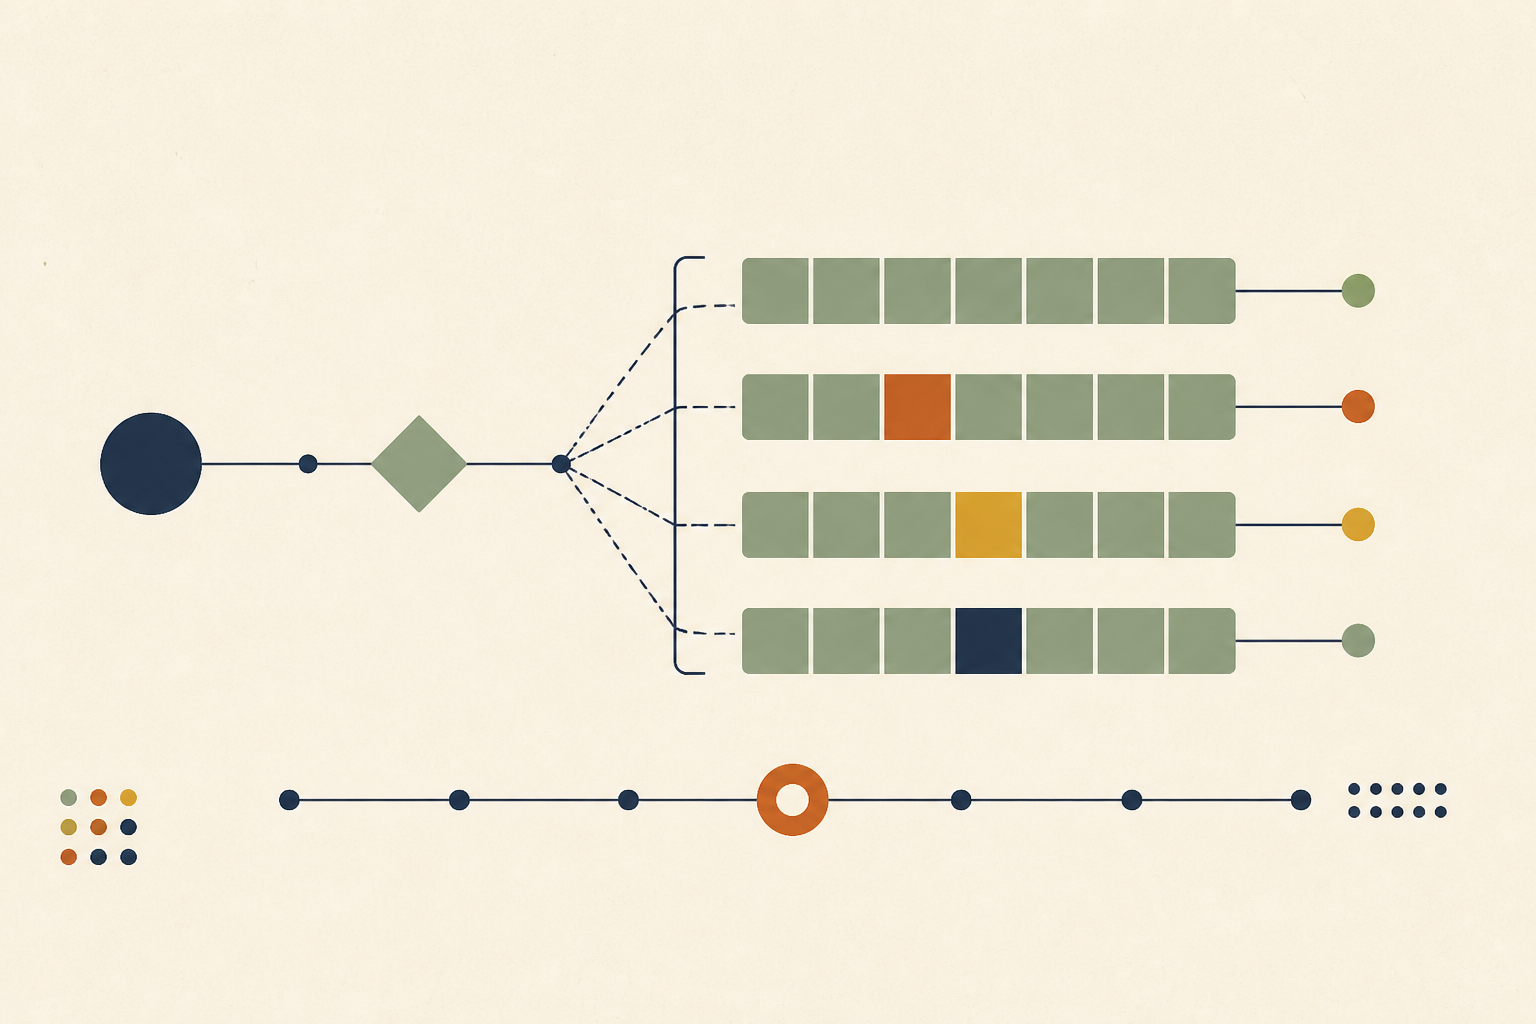
The classes below are the ones we reach for first. We chose them because each has a documented mechanism, so the explanation does not depend on anecdote.
1. A Network Policy That Silently Drops Traffic
Kubernetes network policies change what is allowed without changing what is reported. The network policy documentation says that by default a pod is non-isolated for ingress and all inbound connections are allowed, and that a pod becomes isolated for ingress if any policy selects it with Ingress in its policy types. After that, only traffic the policies allow gets through.
So a single new policy can cut off callers while the pod, its endpoints and its Service all stay green. The documentation adds that policies are implemented by the network plugin, which means the effective behaviour depends on a component your service dashboards rarely show.
2. A Protocol Timer That Ends Sessions on Schedule
Some protocols carry their own clocks. In SIP, the Session-Expires header conveys the session interval, and RFC 4028 states that "If a session refresh request is not received before the interval passes, the session is considered terminated." A mismatch between who refreshes and who expects a refresh can end every call at the same age.
The infrastructure sees healthy servers and healthy links, because nothing is broken at the node level. A failure that happens at the same elapsed time every time is the signature of a timer, and it is invisible to an uptime check.
3. A Type Conversion That Slows Every Query
Databases convert types implicitly when a comparison mixes them. Microsoft's data type precedence documentation states that when an operator combines expressions of different data types, the type with lower precedence is first converted to the one with higher precedence, and its list ranks nvarchar above varchar.
That means a varchar column compared with an nvarchar value can be converted row by row, which we would expect to prevent an index lookup. CPU, memory and error counts stay flat while latency climbs, so the database looks fine from the outside. Our guide to a Postgres query plan that changes with no deploy shows the same silent slowdown in another engine.
4. A Control Applied at the Boundary
Security groups, IAM roles and mesh policies are often applied by automation at the edge of a service. A change to one of them alters who can talk to whom without touching any workload, so no workload reports a change.
| Edge class | Why the dashboard stays green | First test to run |
|---|---|---|
| Network policy | Pods and endpoints are ready | Send a real request from the caller's namespace |
| Protocol timer | Servers and links are up | Check if failures cluster at a fixed session age |
| Type conversion | No errors, flat CPU and memory | Compare the query plan with the previous one |
| Boundary control | No workload changed | Diff declared against effective permissions |
Test the Path With a Real Request First
When dashboards disagree with users, we trust the users and stop reading the dashboards. The protocol below takes a few minutes and finds most edge failures.
- Send a real request from the caller's side of the path. Use the caller's namespace or host, so the test runs with the same network identity.
- Compare declared and effective configuration. List the network policies, security groups and permissions that apply to the path, not only the ones the team remembers.
- Test the protocol, not the port. An open port proves a handshake at best, so use a probe that speaks the same protocol as the client.
- Look for regularity in the failures. A fixed elapsed time or a fixed payload size points at a timer or a conversion.
- Suspect the layer you do not own. If the application and database are both green, ask who runs the network, the mesh and the cloud routing.
kubectl exec -n CALLER_NAMESPACE deploy/CALLER -- curl -sv http://SERVICE.NAMESPACE:PORT/health
kubectl get networkpolicy -A
The first command tests the path as the caller sees it, and the second lists the policies that could be shaping it. Neither requires any change to production.
Gathering code, configuration, database state and logs into one view is where we find the most time disappears. It is the cross-layer search we would give to dedicated AI agents that bring the relevant evidence together across the environment, with the engineer making the call. We cover the broader detection method in our piece on detecting silent failures from outside the system.
Why Another Dashboard Is the Wrong First Move
The reflex after a false all-clear is to add monitoring. We would wait. Edges are numerous and sometimes ephemeral, so no team can pre-instrument all of them, and a 101st dashboard adds to the load on the responder without adding a decision.
What helps is correlation between layers the team already has. When logs, metrics and configuration contradict each other, the contradiction is the lead. Afterwards, add one synthetic check per critical user journey, because it exercises the edges end to end and does not depend on guessing which one will break.
Our notes on choosing liveness and readiness probes explain what each probe does and does not prove, which helps set expectations for what green means.
When Green Dashboards Are Telling the Truth
Not every green dashboard hides an edge failure, and we would check the symptom before hunting. The complaint may come from one customer segment, one region or one client version, and the platform may be fine for everyone else.
Ask first if the failure is visible to real users or only to a synthetic probe. A probe that fails from one location can say more about that location than about the service. A report from a single user can come from a local network, an outdated client or a cached DNS answer.
If the failure reproduces from the caller's side with a real request, it is an edge. If it reproduces nowhere except in the report, collect a request ID and a timestamp before touching anything.
A Checklist for the On-Call Runbook
We keep this list at the top of the runbook, because it is short enough to read while the pager is still going off.
- Validate the symptom with a real request from the affected side of the path.
- Name the two green components that are failing to talk to each other.
- List recent changes to network policies, mesh rules, permissions and configuration maps.
- Test with a representative payload and protocol, not a ping.
- Record the edge that failed, and add a path-level check for it once the incident ends.
Look Between the Boxes When Everything Is Green
Dashboards green but system down is a failure class, not a mystery. The nodes were healthy, and the damage sat in a policy, a timer, a conversion or a boundary control that no per-node check exercises.
We would add the real-request test to the runbook this week. When you want help assembling cross-layer evidence during an incident, Operate runs dedicated AI agents that investigate production problems with cited evidence and propose fixes for your team to review.
Frequently Asked Questions
We usually find the fault on an edge between healthy components, such as a network policy, a protocol timer or a type conversion. Per-component checks confirm that a process answers its own probe, so they cannot see a path that a real caller can no longer use.
We use it for a failure that produces no error, alert or crash, so monitoring built on errors stays quiet. The system works poorly or not at all, but every signal the team watches reports normal, which is why we start from the user's experience.
We add synthetic checks that send a real request through the whole journey and compare declared with effective configuration on a schedule. A path-level check exercises the edges that component checks skip, and it fails the same way a user would experience.
In our reading it checks that the container reports itself ready, and it does not exercise the network path from a particular caller or the policies applied to it. A pod can pass the probe while a policy blocks the traffic that matters.
We find that once a policy selects a pod for ingress, anything not explicitly allowed is refused without an error on the pod itself. The pod, its endpoints and its Service all stay ready, so only a real request from the caller reveals the block.
About the author

Operate Team
The team behind Operate
Operate Team builds Operate, enterprise AI agents for production operations. Operate answers production questions from Slack and Microsoft Teams, investigates alerts, and reviews performance, security and cost. It finds the root cause with evidence and proposes a fix for an engineer to review, with controlled access to your systems.