AI Agent Monitoring Misses Failures That Return 200 OK
AI agent monitoring that trusts 200 OK misses agents that do nothing. Five silent failure shapes, why dashboards stay green, and what to record instead.
Quick Answer
AI agent monitoring built on status codes, latency and error rates cannot see an agent that returns 200 OK and does nothing. Five shapes cause most of these silent failures. Empty or refused output, tool calls that change nothing, fallbacks that swallow the real error, truncated generations, and stale state passed forward. Catching them takes a written success condition for each step, recorded in production, and alerts on missing outcomes rather than present errors.
AI agent monitoring is the practice of watching an agent pipeline in production, from the model calls to the tool calls to the final result, and deciding when it is broken. Most of it today is inherited from web services. It counts requests, errors and latency, and it treats a 200 response as a success.
We think that inheritance is the main reason agent failures go unnoticed for days. An agent can parse its input, call a model, get a well-formed answer and return 200 while the work it was built to do never happens.
In this post we cover why the status code answers the wrong question, the five silent failures we see most, why standard dashboards stay green through all of them, what to record instead, and a one-hour audit you can run on a single pipeline.
Why a 200 OK Answers the Wrong Question for Agents
HTTP is precise about what a 200 promises. RFC 9110 says "The 200 (OK) status code indicates that the request has succeeded." The request, not the task behind it.
For a classic API those were close enough to treat as one thing. If the handler ran without throwing, the row was written or the page was rendered. Agents broke that link, because the handler's job is now to ask a model what to do and then do it.
We split every agent step into two questions. The transport question asks if the call arrived, parsed and returned. The work question asks if the code was changed, the record updated or the answer grounded in the context it was given. A silent failure is a step where the first answer is yes and the second is no.
Monitoring that only asks the first question will report that silent failure as healthy, every time, for as long as it lasts.
Five Silent Failures AI Agent Monitoring Misses
We sort agent failures that return success into five shapes. Each one passes the transport check, and each one needs a different piece of evidence to catch.
1. The Valid Empty or Refused Response
The model returns well-formed output that passes schema validation, but the content is empty or a polite refusal. Model providers treat this as a normal result. Anthropic's documentation on handling stop reasons says a refusal comes back "as a normal HTTP 200 response, not an error."
The dashboard records a fast, cheap, successful call. The user gets nothing useful, and nobody is paged.
2. The Tool Call That Changes Nothing
The agent calls a tool to update a record, the tool reports success, and zero rows change because the identifier was stale. The agent moves on as if the update happened. This is the same shape as a pipeline step that exits zero without doing its work, which we catalogued in the green no-op taxonomy.
Tool protocols can hide failures one level deeper. The Model Context Protocol tools specification reports API failures, invalid input and business logic errors inside an ordinary result with isError: true, and reserves JSON-RPC errors for protocol problems. A client that only watches for protocol errors treats a failed tool as a working one.
3. The Fallback That Swallows the Error
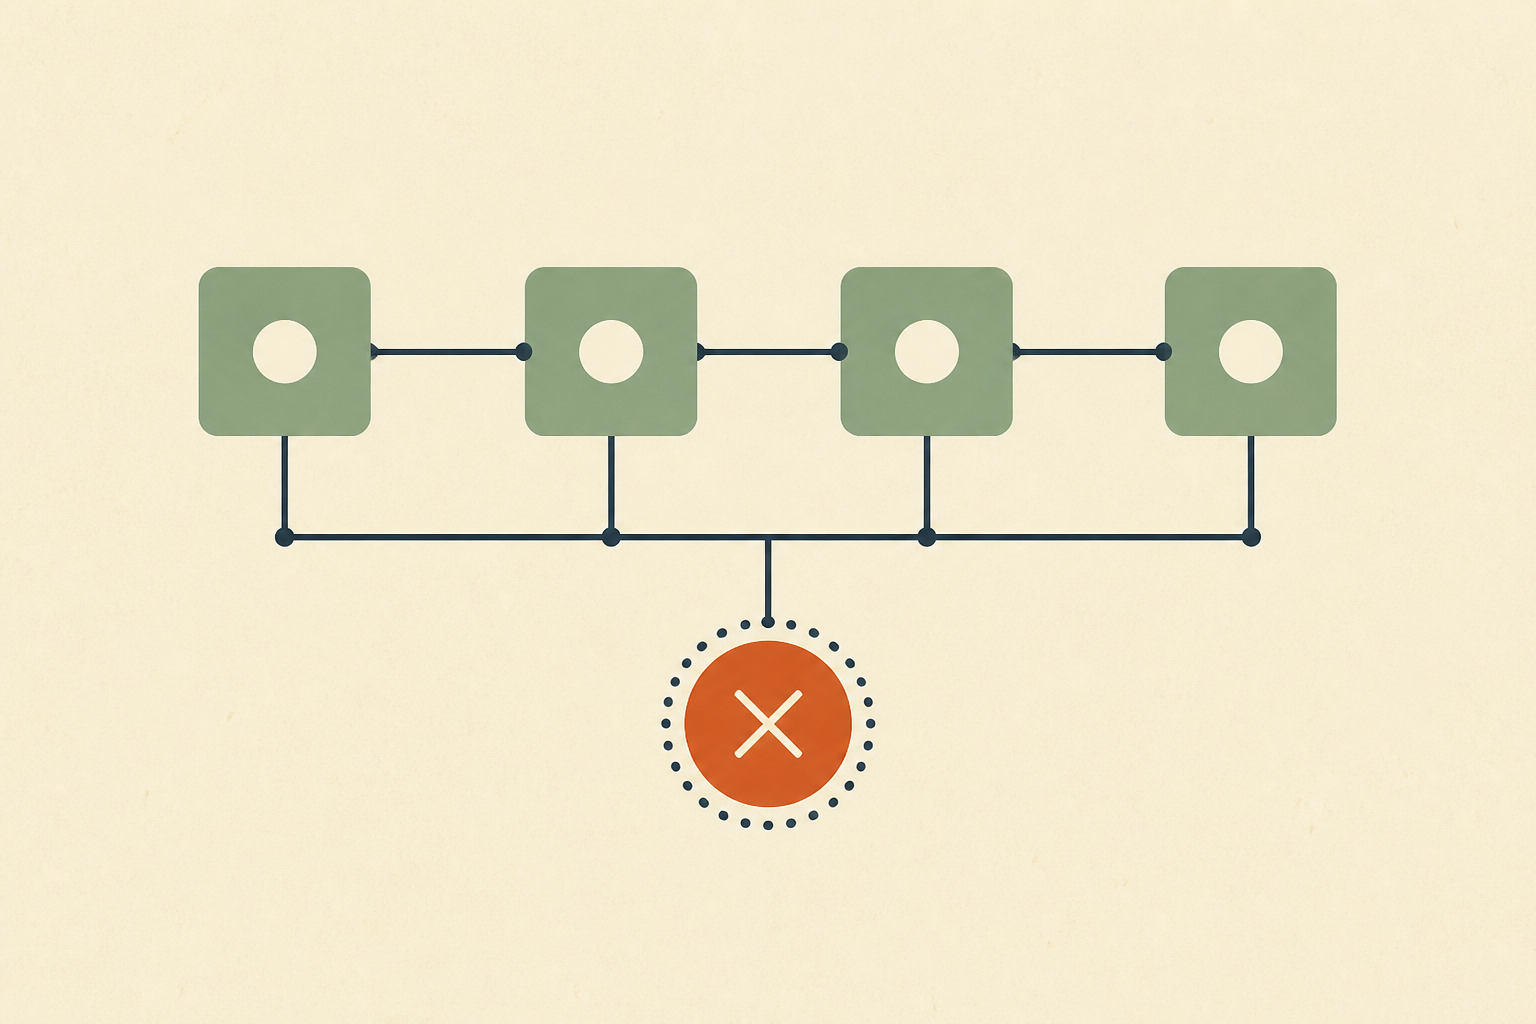
We add retries and fallbacks so one bad call does not break the user's request. When the main path fails and a simpler path returns a generic answer with a 200, the original failure disappears from every graph.
The system is up, but it runs in a degraded mode that nobody is investigating.
4. The Truncated Generation
Generation can stop before the work is finished. Anthropic lists max_tokens as a stop reason meaning the response reached its token limit, and notes that the stop reason field is part of every successful response, while errors arrive as 4xx or 5xx status codes.
A half-written plan or a JSON object cut off mid-list still arrives with a 200. If the pipeline does not read the stop reason, the truncated output flows into the next step as if it were complete.
5. Stale State Passed Forward
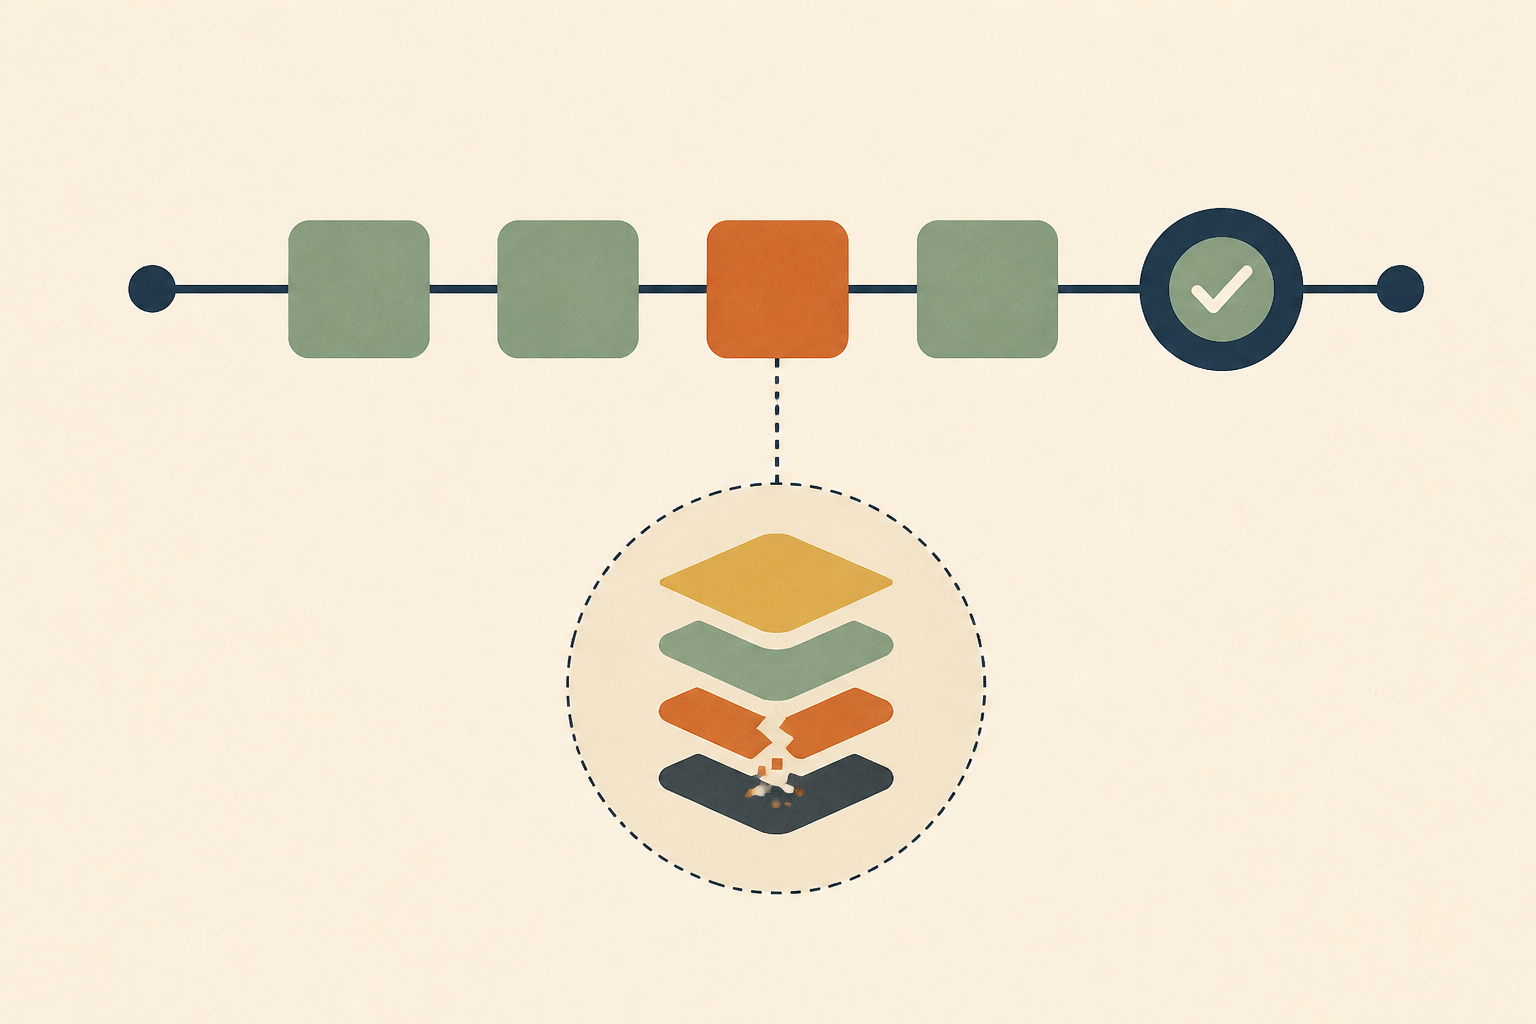
In a multi-step pipeline, one step fails to fetch fresh data but does not raise an exception. It passes along whatever the previous step produced, and every later step runs successfully on old inputs.
The final answer looks complete and well formatted. It is also wrong, and nothing in the trace marks the step where the data went stale.
The table below is the summary we use when reviewing an agent pipeline.
| Silent failure | What the dashboard shows | Evidence that catches it |
|---|---|---|
| Empty or refused response | Fast, successful call | Stop reason and output length per call |
| Tool call that changes nothing | Successful tool span | A read of the target state after the call |
| Fallback that swallows the error | Normal error rate | A counter of requests served by each path |
| Truncated generation | Normal latency | The max_tokens stop reason, recorded and alerted on |
| Stale state passed forward | Every step green | A freshness timestamp checked at each handoff |
Why Golden Signal Dashboards Stay Green During Agent Failures
Most production dashboards are built on the four golden signals from Google's SRE book, which are latency, traffic, errors and saturation. The book already anticipated this problem. It defines errors to include requests that fail "implicitly (for example, an HTTP 200 success response, but coupled with the wrong content)" in its chapter on monitoring distributed systems.
The same chapter notes that catching wrong content takes end-to-end checks, not load balancer counters. In agent pipelines we see the signals move in misleading directions.
- Error rate stays flat, because every call returned a valid response and nothing threw.
- Latency often drops, because a refusal or an empty answer costs less compute than real reasoning.
- Traffic holds steady or rises, because users repeat requests that silently did nothing.
Tracing helps less than teams expect. A span tells us how long a call took and what it returned, but not if the return value mattered. Seeing what an agent did is a different problem from knowing if it was right, and we covered that gap in agent observability versus evaluation.
Instrument the Outcome of Each Step Instead of the Call
The fix is not more telemetry. It is a different kind of record, one that states what each step was supposed to achieve and if it did.
• Write a Success Condition for Every Step
For each step we write one sentence that finishes "this step did its job if". A retrieval step did its job if the context contains the user's account ID. A tool step did its job if the target record now holds the new value.
• Check the World After the Tool Call
We verify the outcome at the boundary instead of trusting the tool's reply. If an agent is meant to open a ticket, a cheap follow-up read confirms the ticket exists. If it does not, the step is marked as failed even though the call returned 200.
• Record Stop Reasons and Tool Error Flags
We store the model's stop reason and the tool result's error flag on every span, and we alert on refusals, truncations and isError results the way we alert on 5xx codes. This costs almost nothing and on its own catches refusals, truncations and reported tool errors.
• Alert on Missing Outcomes, Not Only Present Errors
Silent failures never raise the error graph, so we alert on absence instead. If a pipeline usually creates a comment for most of its model calls and the comment count falls to zero while model calls continue, the work has stopped. The general method of checking a system against an expectation held outside it is the subject of detecting silent failures from outside.
When one of these alerts fires, root cause analysis needs the logs, the database rows the agent touched and the code path together. We prefer to give an investigator that access through read-only, self-hosted investigation rather than broad write credentials, because the pipeline under suspicion already has those.
A One-Hour Audit of One Agent Pipeline
We run this audit on the highest-traffic agent path first, because that is where a silent failure costs the most.
- List every discrete step, such as retrieval, model call, tool call, validation and handoff.
- Write the success condition for each step in one sentence.
- Open your production telemetry and check if that condition is recorded anywhere today.
- Mark every step whose condition is unrecorded. Those steps are where silent failures can live.
- Add the cheapest evidence first, which is usually the stop reason, the tool error flag and a per-path counter.
The audit rarely needs new tools. It needs someone to decide, in writing, what success means for each step, and that decision is usually the part nobody owned.
When Outcome Checks Cost More Than They Catch
We do not add an outcome check to every step. Some steps fail loudly on their own, and a check would only duplicate an exception that already pages.
Verification reads also cost money and latency. A follow-up read after every write on a hot path adds load to the system it is meant to protect, so we sample those checks instead of running them on every call. The same trade-off shows up in clinical labs, which run a control sample through each batch rather than retesting every specimen, as we described in exit zero is not evidence.
Finally, some agent outputs have no cheap ground truth. For open-ended answers, a written success condition may only be checkable by a human review of a sample, and we treat that as acceptable rather than pretending a metric can do it.
Start AI Agent Monitoring With One Written Success Condition
We would pick one pipeline, write the success condition for each step, and record the stop reason and tool error flag on every call before adding anything else. That alone makes several of the five shapes visible.
Good AI agent monitoring watches what the agent changed, not only what it returned. When something does go wrong, Operate helps find out why. It brings the evidence from logs, databases and code together through read-only adapters, and proposes any code fix as a patch file an engineer reviews and applies.
Frequently Asked Questions
It is watching an agent pipeline in production and deciding when it has failed. We include model calls, tool calls and the final result, and we judge each step by the outcome it was meant to produce. Status codes and latency alone miss agents that return success while doing nothing useful.
In our experience they fail most often in ways that still look like success. Typical cases are empty or refused answers, output cut off at a token limit, confident answers built on stale context, and tool calls that report success without changing anything. Each needs evidence beyond the response code to detect.
A silent failure is a fault that produces no error signal, so monitoring reports the system as healthy while the work is not being done. We see it most where success is measured by a status code or an exit code rather than by checking the outcome the step was supposed to produce.
We monitor AI systems at two levels. The first is operational, covering latency, cost, errors and stop reasons for each model call. The second is outcome-based, checking that each step achieved its written success condition. Teams that only do the first level usually miss failures that return a normal response.
The failure modes we track are refusals, empty output, truncation at the token limit, malformed structured output, ungrounded or hallucinated content, and tool calls with wrong or stale arguments. Several of them arrive as normal successful responses, which is why we record the stop reason and validate output on every call.
About the author

Operate Team
The team behind Operate
Operate Team builds Operate, enterprise AI agents for production operations. Operate answers production questions from Slack and Microsoft Teams, investigates alerts, and reviews performance, security and cost. It finds the root cause with evidence and proposes a fix for an engineer to review, with controlled access to your systems.