How to Choose Logs or Traces During a Production Investigation
We compare logs and traces, validate correlation IDs, diagnose missing spans and preserve the evidence needed for a production debugging review.
Quick Answer
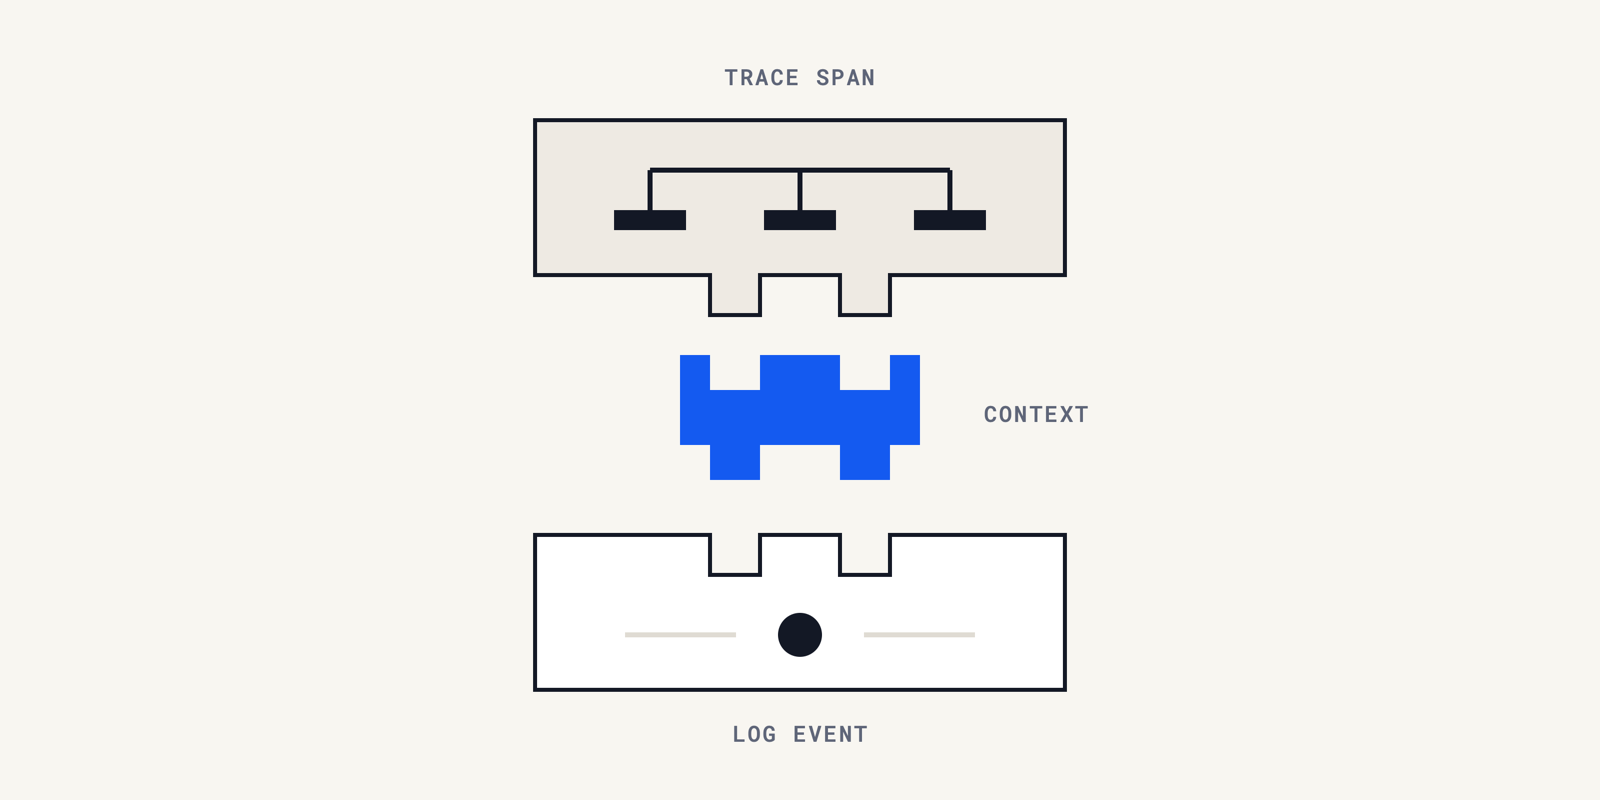
Start with logs for a specific event or exception and traces for a request’s path and timing. Before joining them, compare raw and stored identifiers, service identity and the recording context. Classify missing records separately from conflicting records because sampling, retention or instrumentation gaps can hide a valid request. Preserve the evidence and the limits of each match. A successful correlation supports investigation, but it does not establish the cause of the failure.
Distributed tracing records related work across instrumented components, helping us connect evidence during production debugging. An error beside a slow request can look like the explanation before we have checked that the two belong together.
That relationship matters as much as the error message. A dashboard can put two records close together even when the underlying join is incomplete.
We want to know what evidence the link actually carries before proposing a fix. We’ll cover where to start, how to validate the join, how to diagnose missing evidence and what to preserve for review.
Choose Logs or Traces by the Evidence Your Production Debugging Needs
We start with the signal that can answer the unresolved question, then validate the connection to the other signal. Distributed tracing helps establish a request’s recorded path. Log correlation adds event detail only when the relationship holds up.
1. Choose a Starting Signal From the Unanswered Question
For logs vs traces, we use the question as the selection rule. We do not make one signal the default simply because its dashboard is easier to open.
| Unresolved Question | Starting Evidence | Follow-Up Before Drawing a Conclusion |
|---|---|---|
| Which exception or application decision was recorded? | Relevant log record and its emitting code | Check the request context and actual persisted outcome |
| Which instrumented operation consumed the request’s time? | Trace with operation timing and relationships | Inspect coverage and the event detail for the suspected operation |
| Does this log belong to this specific operation? | Raw identifiers from both records | Compare the trace ID, span ID and emitting resource |
| Why does the log’s trace link open nothing? | Log record plus collection and retention configuration | Establish if the trace was recorded, exported and retained |
The OpenTelemetry trace documentation describes spans as units of work connected into a trace. Its worked hello example shows related spans sharing a trace identifier while retaining distinct span identities.
We use that distinction when reading a request. Several records can belong to the same trace without describing the same operation. A trace-level match is a starting point. It is not permission to attach every error in the trace to the selected span.
Our deadline investigation guide illustrates another attribution trap. The component reporting a timeout may be the caller that stopped waiting. We keep the emitting component separate from the component suspected of causing delay.
For repeated database work, we would inspect the recorded operation sequence before deciding what an isolated error means. The production N+1 investigation is a useful next step when repeated database calls, rather than an exception, explain the request shape.
2. Validate the Raw Event Against the Stored Span
We compare the raw log with the stored fields before trusting a clickable trace link. This catches a different problem from application debugging. A parser or field-processing rule may have changed the evidence used by the interface.
First, we preserve the original event and inspect the extracted identifier fields. We compare values as identifiers, using the encoding expected by the actual instrumentation and backend. We do not manually truncate a value to make two displays agree.
The OpenTelemetry convention for non-OTLP logs specifies lowercase hexadecimal trace_id and span_id fields. That convention is a reference for compatible formats, not a promise that every vendor’s older format looks identical.
Next, we inspect the selected span’s identity and its resource. The service, deployment environment and version should make sense for the event’s source. We investigate contradictory metadata before accepting the join, even if the identifier looks right.
Datadog’s correlation documentation makes the parsing requirement concrete. Language-level logs must become attributes, and service, environment and version fields support correlation. A visible string in a message is not necessarily an indexed correlation field.
We then inspect the logging call’s context. Was the event emitted while the intended operation was active, or after execution moved into another task? The answer comes from the instrumentation and code path, not from the position of a row in a waterfall.
The OpenTelemetry log data model makes trace and span identifiers optional. It also distinguishes event time from collection observation time. We therefore record which timestamp the interface uses before treating a timing disagreement as an application defect.
3. Classify the Join Before Accepting It
We classify a log-to-trace join by the evidence available, with a specific next check for each unresolved state. This table is our review method. It is not a vendor guarantee or a report of a measured production incident.
| Observed State | Decision for This Investigation | Next Check |
|---|---|---|
| Raw and stored IDs agree; span and resource fit | Accept the recorded relationship, with stated coverage limits | Read the event and operation together, then test the causal explanation |
| Raw event has an ID but stored field is absent or different | Hold the join | Inspect parsing, remapping and identifier encoding |
| Trace ID matches but no span ID is available | Accept only trace-level context | Inspect instrumentation before assigning the event to one operation |
| Log has identifiers but the trace or span cannot be found | Leave the relationship unresolved | Check retention, sampling, export and query scope |
| IDs match but service or environment conflicts | Hold the join | Check resource tagging, routing and stale execution context |
| Event and displayed timing disagree | Hold timing-based attribution | Check timestamp meaning, clock sources and display adjustments |
We preserve the unresolved state instead of silently dropping it from the investigation. An engineer should be able to distinguish a failed search from evidence that contradicts the proposed relationship.
Our acceptance boundary is narrow because the records support a stated relationship at a stated level of detail. It does not mean the log message is accurate, the trace is complete, or the application performed the business action it claimed.
Pro tip: We save the raw event and the parsed fields together. A screenshot of a successful trace link cannot show which parser mapping made the link possible.
Test Context Propagation at the Boundary That Lost the Request
We test context propagation at a specific boundary, using a controlled request and an expected relationship. Distributed tracing can only connect the work that the instrumentation represents correctly. A successful check on one path does not validate every path.
1. Record the Boundary and Its Expected Relationship
We identify the caller, receiver and transport before changing instrumentation. The check should say which outgoing operation and incoming operation are supposed to connect, and where their evidence will be collected.
OpenTelemetry’s context propagation guide describes injecting context into a carrier and extracting it at the receiver. Its frontend, cart and product-catalog example shows why this work crosses component boundaries.
For an HTTP boundary, we would inspect the emitted and received trace context through approved diagnostic facilities. We keep sensitive payloads out of the evidence bundle and record the instrumentation version alongside the observed relationship.
We do not declare success because a header exists. Our check must reach the receiving operation and its emitted telemetry, with the expected relationship visible in retained data. Otherwise we have verified transport of a value, not the whole recording path.
2. Check the Context After Asynchronous Work Starts
We inspect the context where asynchronous work actually executes. Checking the request handler alone leaves the worker, callback or message consumer untested.
A new operation can require a different relationship from a simple nested call. OpenTelemetry’s span-link guidance supports relationships between spans that do not fit a single parent-child tree, including work linked across traces.
We write the expected relationship before interpreting the visualization. A valid link to another trace should not be marked broken merely because a reviewer expected one continuous waterfall. Equally, a plausible waterfall should not excuse context attached to unrelated work.
When a boundary fails, we retain the failing evidence and ask for a narrowly scoped instrumentation change. We then repeat the same controlled path and compare the relationship, not just the number of spans appearing on screen.
Connected evidence helps production debugging when code, logs and records need to be reviewed together. We still require the investigation to identify the missing boundary and support the proposed change.
3. Keep Identity Separate From Proof of Cause
We treat matching trace context as a recorded association, not authentication of the caller or proof of the message’s truth. An external component may supply or modify context, and an application can emit an incorrect statement within an otherwise valid span.
The W3C Trace Context specification explicitly discusses trust boundaries and maliciously supplied context. It also warns that the sampled flag is no guarantee that trace data will be recorded.
We therefore keep business outcome evidence separate. A log claiming completion needs the relevant authoritative state before we conclude that the action completed. An error attached to a span needs a mechanism connecting it to the customer’s symptom before we call it the cause.
Treat Missing Traces as a Coverage Question Before a Diagnosis
We investigate missing distributed tracing data as a coverage problem before using absence to explain application behavior. A failed trace lookup tells us that the current search did not return the record. It does not tell us why.
1. Check Retention and Sampling in Each Store
We record the search scope, incident window and retention configuration for each source. Logs and traces may have different storage policies, so availability in one source cannot establish availability in the other.
Datadog documents that logs and traces are sampled independently. A log can contain a trace identifier even when the trace was not ingested or retained. We do not classify that state as a configuration error without further evidence.
We inspect trace sampling decisions at their actual locations. The OpenTelemetry sampling guide distinguishes decisions made early from those made after more of the trace is available. Data dropped upstream cannot be reconstructed by a downstream decision.
We ask for the effective policy at the time of the event, not only the policy currently displayed. A later configuration change may make a controlled test succeed while leaving the earlier request permanently unresolved.
Our investigation notes separate three conclusions. A policy could explain missing data. A collector reported a drop. A particular record is known to have expired. Those are different levels of evidence, and we avoid presenting the first as the last.
2. Validate the Instrumentation Change Without Rewriting History
We validate a repair against a defined path and expected records. A newly visible span establishes that the repaired path now records that operation under the tested conditions.
It does not recover a historical request or prove that every request follows the same branch. We retain the old uncertainty and give the new test its own identity, configuration version and observation window.
We also check the cost of the change before expanding it. The sampling guide describes state and resource demands for tail sampling; collecting more data is an engineering tradeoff, not an unlimited debugging allowance.
For a bounded review, we would name the paths to test, the evidence to retain and the condition for ending the extra collection. This keeps a temporary investigation from becoming an undocumented permanent telemetry policy.
Pro tip: We attach the effective sampling and retention settings to the investigation before they change. A current settings screenshot cannot establish which policy governed an older request.
Save the Join Decision So Another Engineer Can Reproduce It
We save the join decision with enough source detail for another engineer to repeat the checks. Distributed tracing becomes more useful when a reviewer can see exactly what was matched and what remains uncertain.
1. Keep an Acceptance Record With the Evidence
We use a compact acceptance record rather than a conclusion pasted beside a dashboard image. Each entry points to an actual observation or is explicitly marked unavailable.
| Record Field | What We Preserve |
|---|---|
| Question | The event or operation we are trying to connect |
| Source locators | Log and trace locations, search window and query scope |
| Raw and stored identity | Identifier values and the mapping used to compare them |
| Resource and context | Emitting service, environment, version and known execution boundary |
| Coverage | Relevant retention, sampling and collection evidence |
| Decision | Accepted relationship, limited trace-level match, held conflict or unresolved absence |
| Next check | The observation needed to advance or reject the explanation |
We keep access to that record consistent with the source permissions. Copying diagnostic material into an unrestricted document is not necessary to make an investigation reproducible.
A reviewer should be able to reopen the source, recognize the same event and understand why we accepted only a trace-level relationship if the span was missing. That limitation belongs in the decision itself, not in a footnote that disappears when copied.
2. Move From Correlation to a Falsifiable Explanation
We use an accepted join to narrow the investigation, then test the proposed mechanism against code and state. We do not turn the acceptance record into a declaration that root cause analysis is finished.
Our root cause analysis procedure explains how to test hypotheses and account for the conditions behind a failure. A validated log-to-trace relationship supplies evidence for that work; it does not replace it.
For the suspected operation, we would name the observation that would contradict the explanation before recommending a change. If the available evidence cannot distinguish two explanations, the next action is to obtain that evidence or retain the uncertainty.
Start the Next Production Debugging Review With an Explicit Join Decision
We would start the next production debugging review with the unanswered question and one relevant request. We would then record the relationship supported by its logs and distributed tracing data, including any missing span or conflicting resource identity.
That gives the next engineer a concrete starting point with the evidence checked, the relationship accepted and the next observation still needed. It also prevents a later instrumentation repair from quietly rewriting what the team knew about the original failure.
When the explanation requires connected code, logs and production records, Operate can bring those sources together and suggest a change for engineers to review.
Frequently Asked Questions
We avoid treating three as a universal taxonomy. The OpenTelemetry log model groups sources into system formats, third-party applications and first-party applications. That grouping describes control over generation and format. It does not prescribe which records every team must collect or retain.
We read TRACE as a finer log level than DEBUG, not proof that a trace exists. OpenTelemetry maps both to debug events. We check the framework’s rules before enabling TRACE; more log detail alone does not create distributed tracing spans.
We treat monitoring as the activity of collecting and interpreting system signals for operational decisions. Google’s SRE guidance includes logs among possible monitoring inputs. Saving log files alone does not define an alert policy, a service health objective or who should respond to a problem.
We use telemetry as the broader category of system outputs collected for observation. Logs are one signal within that category. OpenTelemetry also describes metrics, traces and baggage. We ask which signal a proposed collection change supplies before calling it a complete telemetry plan.
We would pair the person who understands the product rule with the person who can inspect the relevant systems. Job titles alone should not decide the handoff. Agree on investigation ownership, appropriate read access and who reviews the proposed code or configuration change.
About the author

Operate Team
The team behind Operate
Operate Team builds Operate, enterprise AI agents for production operations. Operate answers production questions from Slack and Microsoft Teams, investigates alerts, and reviews performance, security and cost. It finds the root cause with evidence and proposes a fix for an engineer to review, with controlled access to your systems.