How to Catch the N+1 Query Problem in Production
The N+1 query problem passes review and tests, then grows with your data. How to catch it in production telemetry, fix it safely and keep it from returning.
Quick Answer
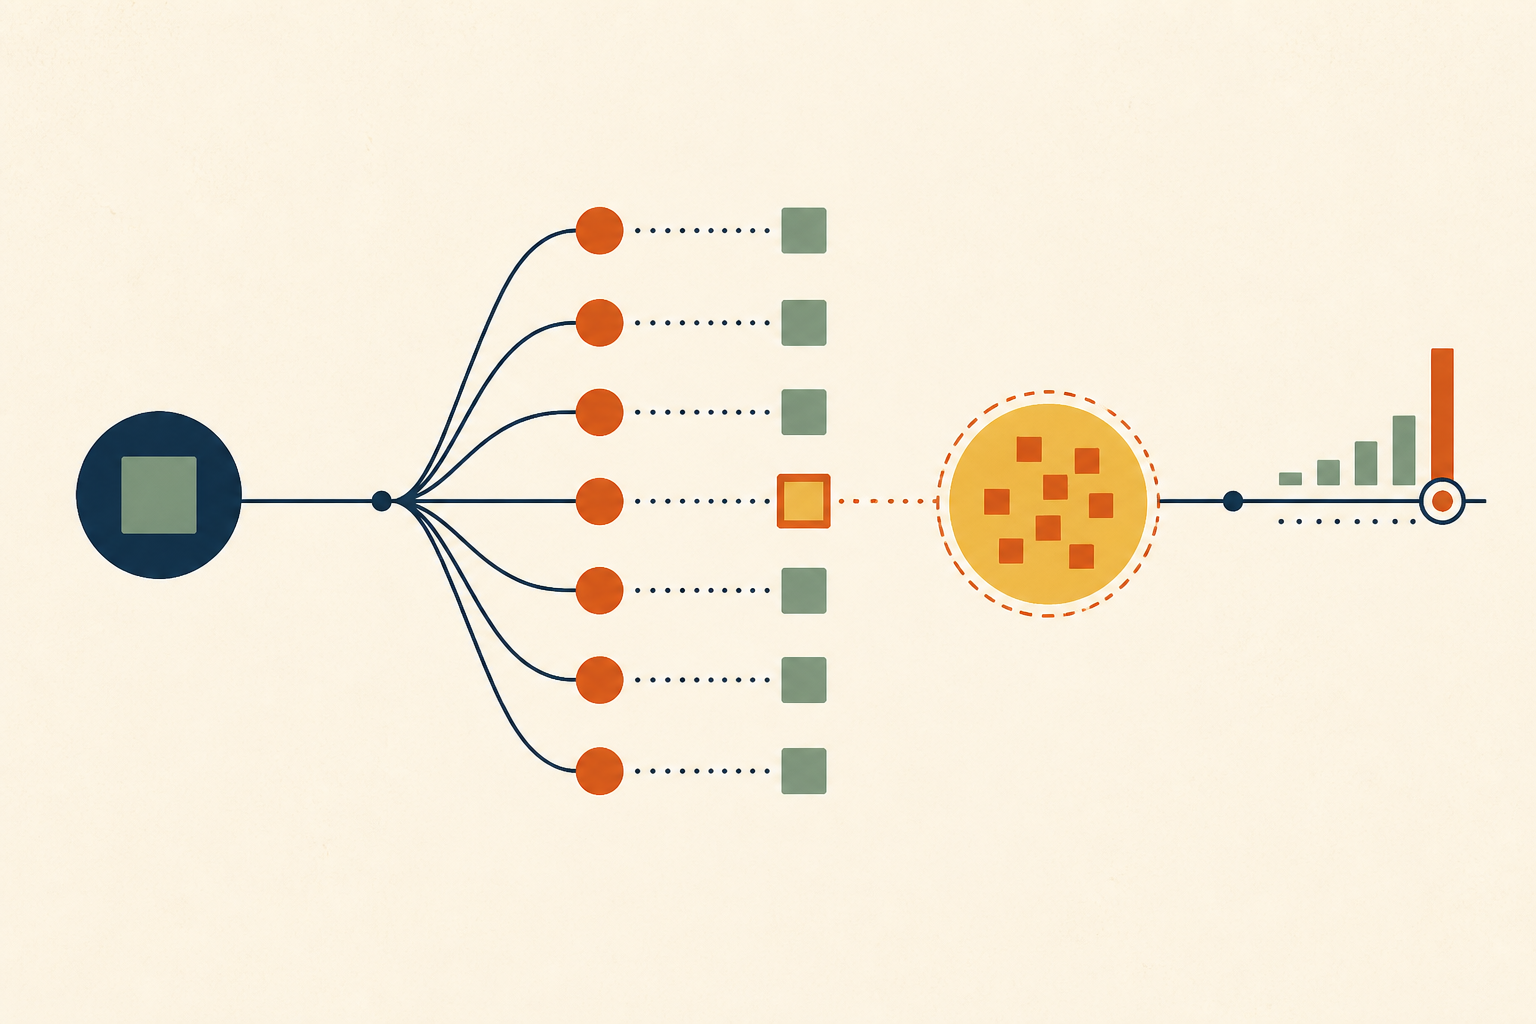
An N+1 pattern happens when code loads a list with one query and then runs one more query per item to fetch related data. It hides in code review and small test fixtures, then grows with production data until an endpoint slows down or the connection pool runs dry. Production telemetry exposes it through query counts that track result size, high-call low-row statements and long runs of identical database spans.
The N+1 query problem is a data access pattern in which an application runs one query to fetch a set of parent records and then N further queries, one for each record, to fetch related data. We treat it as a production problem first, because that is the only place it reliably shows up.
Most explanations stop at the fix, which is usually eager loading. The harder part is finding the N+1 that already shipped, among hundreds of endpoints, before users notice.
In this post we cover what the pattern looks like, why it survives review and tests, what it costs at real data sizes, how to detect it in production telemetry, how to fix it without creating a new problem, and when it is not worth fixing.
What the N+1 Query Problem Looks Like in Code
Object-relational mappers load related records lazily by default, which means a relationship is fetched the first time code touches it. A loop over a list that reads one related field per item therefore issues one query per item.
The Laravel documentation on eager loading gives the clearest worked example we know. Looping over books and printing each author's name "will execute one query to retrieve all of the books within the database table, then another query for each book in order to retrieve the book's author." With 25 books, that is 26 queries.
Nothing in the loop looks like database access. In most ORMs the code reads like ordinary property access, which is exactly why the pattern is so easy to write.
Why N+1 Queries Pass Review, Tests and Staging
We see the same three reasons every time an N+1 reaches production. None of them involve careless engineers.
• Lazy Loading Reads Like Clean Code
A reviewer sees order.customer.name inside a loop and reads a property, not a network round trip. Unless the reviewer is specifically hunting for hidden I/O, the line passes.
• Test Fixtures Are Tiny
A test with five rows runs six queries against a local database in a few milliseconds. The suite stays green and fast, so nothing signals that the same code will run hundreds of queries against real data.
• The Regression Grows With Data, Not With Deploys
When a feature launches, its tables are small and N is low. As customers accumulate records, N grows and the endpoint slows a little each week. With no single bad deploy to point at, dashboards usually attribute the slowdown to general growth.
The first visible symptom is usually in the tail. Customers with the most records hit the largest N, so the endpoint's p99 drifts up long before its median moves, which is why we read the tail first, as described in our p99 latency field guide.
What an N+1 Costs at Production Cardinality
We use a simple worked example to show the scale. A dashboard lists 100 recent orders with each customer's name, and each database round trip takes about 2 ms including network time.
| Approach | Queries | Round trips | Approximate database time |
|---|---|---|---|
| Eager load with one batch query | Orders, then customers where id is in the list | 2 | About 4 ms plus query work |
| N+1 lazy loading | Orders, then one customer query per order | 101 | About 200 ms plus query work |
Latency is only half the cost. Each of those 101 queries holds a database connection while it runs, so a handful of concurrent requests to one N+1 endpoint can tie up a pool that every other endpoint shares. That is how an N+1 on one page shows up as connection timeouts on unrelated pages, a failure class we examine in the WorkOS connection pool analysis.
How to Detect the N+1 Query Problem in Production Telemetry
Tutorials assume you already know which endpoint has the problem. In production we usually do not, so we work through four signals, from the cheapest to collect to the most specific.
1. Count Queries per Request
The most direct signal is the number of database queries each request or background job executes. Most APM agents and ORM instrumentation can attach that count to a request. An endpoint whose query count rises in step with the number of items it returns has an N+1, almost by definition.
2. Read pg_stat_statements for High Calls and Low Rows
On PostgreSQL, the pg_stat_statements view records, per normalized statement, how many times it was executed and the total rows it retrieved or affected. We sort by calls and look for statements whose rows divided by calls is close to one. A lookup by primary key called hundreds of thousands of times an hour, returning one row each time, is the classic fingerprint of a lookup inside a loop.
The view's counters are cumulative until someone resets them, so we compare two snapshots taken an hour apart rather than reading the totals. Which tools keep that history for you after an incident is a separate question, covered in our look at Postgres monitoring tools.
3. Look for the Comb Shape in Traces
In a distributed trace, an N+1 shows up as one short span for the parent query followed by a long run of near-identical short spans for the child lookups. Because the ORM usually issues them one after another, they form a comb that dominates the request's timeline. Once we have the endpoint from step 1 or 2, a single trace usually confirms it, and the span attributes point at the code path that issued the loop, which closes the root cause analysis.
4. Turn On Framework Tripwires
Several frameworks can refuse lazy loading outright, which turns a silent N+1 into a visible error in development and tests:
- Laravel's
Model::preventLazyLoading(), which the docs show enabled outside production in the application's service provider. - Rails
strict_loading, which the Active Record querying guide describes as a way to make sure no associations are lazy loaded. - Django's
assertNumQueriesin tests, which asserts the exact number of queries a function executes.
The first three signals need production access to logs, traces and the database at once. If the investigation keeps stalling on access, it is worth setting up an investigator you can connect read-only to your logs and database so the next one starts from evidence.
Fixing N+1 Queries Without Creating the Next Problem
The fix is almost always some form of eager loading, but the form matters. We choose between three.
- A batch query with an
INlist. Django's prefetch_related retrieves each relationship in one extra batch query, and Laravel'swith()works similarly. This is our default. - A join. Django's
select_relatedfollows foreign keys with an SQL join in the same query. It suits single-valued relationships, but on one-to-many relationships it repeats the parent columns for every child row and can inflate the result. - Request-level batching. In GraphQL resolvers, where each field resolves separately, the DataLoader pattern coalesces individual loads made within a single tick of the event loop into one batch call.
After the fix we confirm the query count dropped on the same endpoint, and we check the new query's plan, because a large IN list or a wide join can become slow in its own right. Plan changes have their own failure modes, which we cover in our guide to Postgres query plan changes.
When an N+1 Query Is Not Worth Fixing
We do not treat every N+1 as a bug. Three situations make it acceptable.
• N Is Small and Bounded
An internal admin page that always lists a handful of records costs a few extra milliseconds. If N cannot grow with customer data, the simpler code may be worth keeping.
• The Related Data Is Already Cached
When the per-item lookup hits an application cache rather than the database, the loop costs memory reads, not round trips. We still check the cache hit rate before relying on it.
• The Eager Version Is Worse
Occasionally the join or batch query is slower than many tiny indexed lookups, for example when the related rows are very wide and most are never displayed. We measure both before choosing.
Make the N+1 Query Problem a Number Someone Reviews
We would add a query budget to tests for the endpoints that list things, so a change that moves a list endpoint from 2 queries to 50 fails CI. In production, we would alert on queries per request by endpoint and look first at any endpoint whose count jumped after a deploy.
Handled that way, the N+1 query problem stops being a slow surprise and becomes a number with an owner. When one still slips through, Operate is built for the investigation. It brings the evidence from logs, databases and code together through read-only adapters, and proposes any code fix as a patch file an engineer reviews and applies.
Frequently Asked Questions
It is the pattern where code runs one query to fetch a list and then one extra query per item to fetch related data. We see it most with ORMs that load relationships lazily. A list of 100 items becomes 101 queries, and the cost grows as the data grows.
We solve it by loading the related data up front, usually with one extra batch query using an IN list, or with a join for single-valued relationships. After the change we confirm the query count dropped on that endpoint and check that the new query's plan is efficient.
Lazy loading is the usual cause. The ORM fetches a related record only when code first touches it, so reading that field inside a loop issues one query per iteration. We find it survives review because the code looks like ordinary property access rather than database calls.
In GraphQL each field resolves independently, so a list field whose items each resolve a related object can trigger one lookup per item. We fix it with request-scoped batching, such as DataLoader, which gathers the individual loads in one tick and fetches them in a single call.
In Django it appears when a template or loop reads a foreign key or reverse relation on each object of a queryset. We fix it with select_related for foreign keys, which joins them into one query, or prefetch_related for many-valued relations, which adds one batch query per relation.
About the author

Operate Team
The team behind Operate
Operate Team builds Operate, enterprise AI agents for production operations. Operate answers production questions from Slack and Microsoft Teams, investigates alerts, and reviews performance, security and cost. It finds the root cause with evidence and proposes a fix for an engineer to review, with controlled access to your systems.