What Is p99 Latency? A Field Guide for Teams Whose p50 Looks Fine
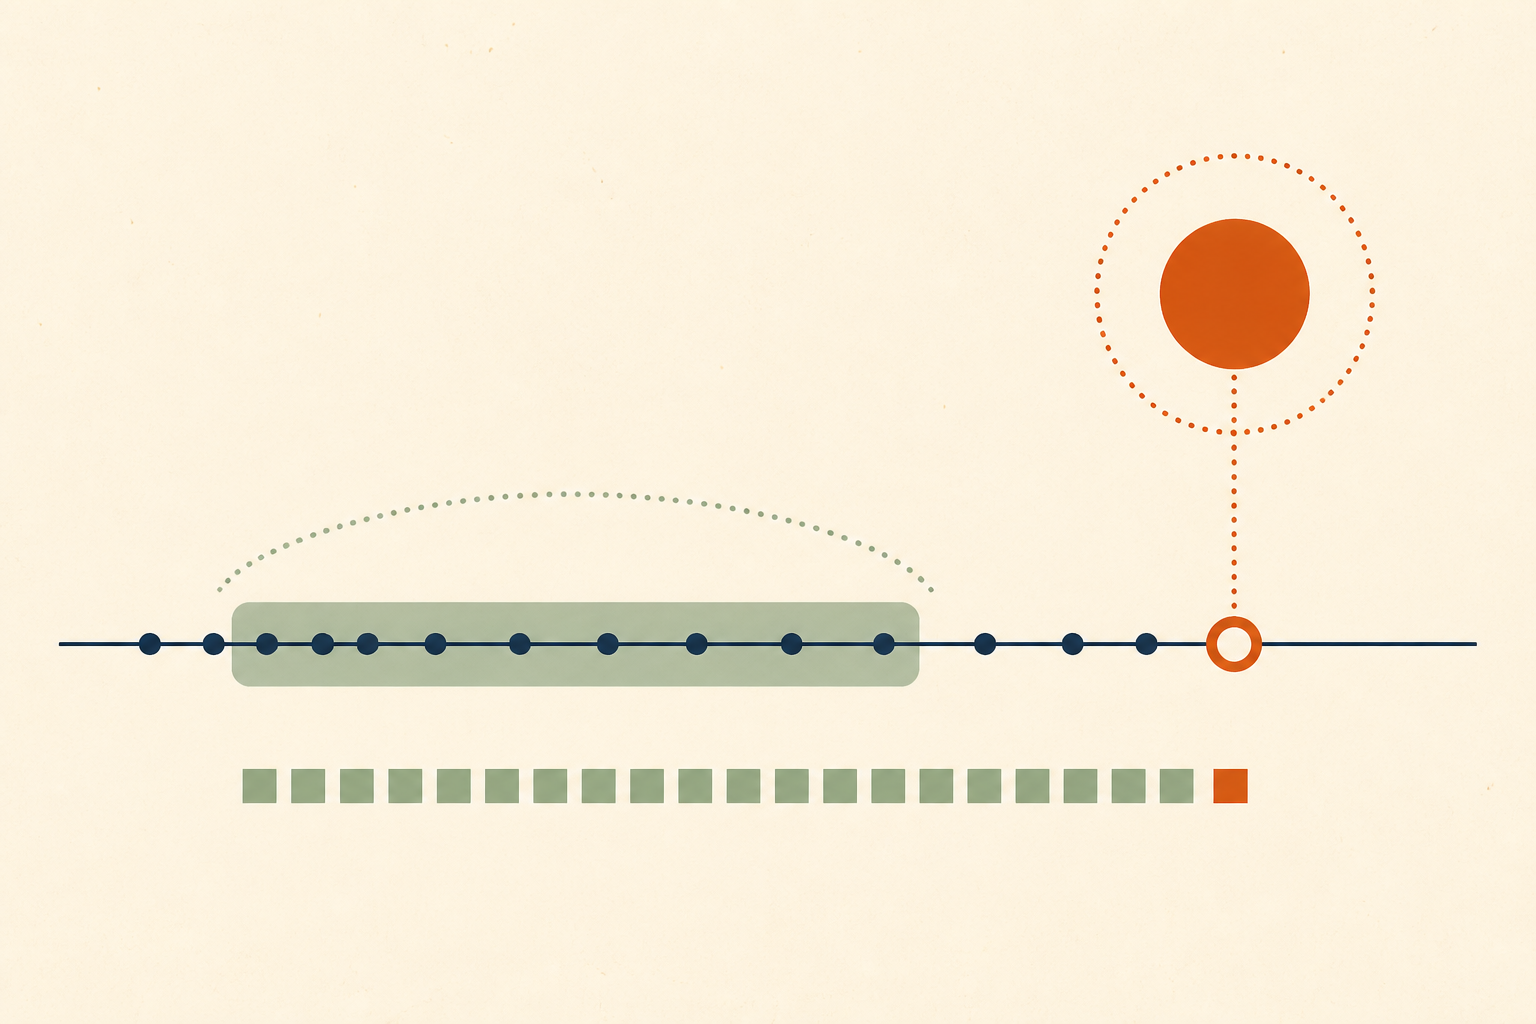
TL;DR: p99 latency represents the 99th percentile of response times, indicating that 99% of requests are faster than this value while the slowest 1% are slower. It is the gold standard for measuring tail latency because it captures the worst-case experiences that often affect a system's most active users.
If your monitoring dashboard shows a flat, green line for average response times but your support inbox is filling with complaints about timeouts, you are likely a victim of a tail regression. This is the paradox of modern observability: the metrics we use to summarize system health often hide the very failures that cause user churn.
Understanding what p99 latency actually measures—and why it moves independently of your median performance—is critical for maintaining a reliable production environment.
Key Takeaway: Percentiles are the only latency numbers that correspond to real requests; tails move without deploys; and a repeatable localization workflow turns a vague "it feels slow sometimes" into a diagnosable case.
What p99 latency actually is
In simple terms, p99 meaning refers to the 99th percentile of a dataset. If you have 100 requests, and you sort them from fastest to slowest, the p99 value is the response time of the 99th request. According to [Hamming AI], p99 latency is a key metric in voice AI and high-performance APIs because it represents the "worst-case" experience for the vast majority of users.
Why your average and p50 are structurally incapable of seeing the problem
Most teams rely on the p50 (median) or the arithmetic average to judge performance. These metrics represent the "typical" experience. However, averages are mathematically dangerous in distributed systems because they are heavily skewed by outliers or, conversely, they bury them entirely.
If 99 requests take 10ms and 1 request takes 10 seconds, your average is 109ms. This "average" represents no one; it is too slow for the fast users and too fast for the user who timed out. The p50 would stay at 10ms, signaling perfect health while a critical failure is occurring. This is why tail latency (the latency at the edges of the distribution) is the only way to see the "outlier" pain that averages mask.
Request math vs session math: who actually hits the tail
A common trap is assuming that a 1% tail latency only affects 1% of users. In reality, the impact is much higher due to the difference between request math and session math.
1 percent of requests is not 1 percent of users
A single web session or page load rarely consists of just one request. A typical dashboard might make 20-30 API calls to render. If each request has a 1% chance of hitting the p99 tail, the probability that a user experiences at least one "slow" request during their session climbs significantly.
Heaviest accounts make the most requests
Your "power users"—the enterprise accounts with the most data and highest seat counts—are your most frequent samplers of the tail. Because they make orders of magnitude more requests than a trial user, they are statistically guaranteed to hit the p99 latency wall. According to [Jasmine Park on Medium], a team found their p50 SLO was green all quarter while nearly 1 in 10 user sessions hit a wall because the tail was saturated.
The tail regressions that ship without a deploy
Many engineers assume that if they haven't deployed code, latency shouldn't change. This is false. p99 latency often degrades due to environmental and data shifts:
- Data growth: A query that takes 12ms with 10k rows might hit a "tipping point" at 100k rows where the database optimizer flips from an index scan to a sequential scan, suddenly taking 800ms.
- Cache hit-rate drift: As your dataset grows or access patterns shift, your cache efficiency can drop. The p99 often represents the "cache miss" path.
- Connection-pool saturation: When a few requests hang, they hold onto database connections. New requests must wait for a connection to become free, creating a "queueing" effect that bloats the tail.
- GC and runtime pauses: Languages with garbage collection (Java, Go, Node) may experience "stop-the-world" pauses. These pauses almost exclusively manifest in the p99 and p99.9 metrics.
- Noisy neighbors: In cloud environments, a different tenant on the same physical hardware might spike in CPU usage, causing "steal time" that slows down your process.
Localizing a tail regression: a workflow
When the tail moves, you need a systematic way to find out why.
- Histograms, not averaged percentiles: Stop averaging percentiles across clusters. This is mathematically invalid. Use heatmaps or histograms to see the actual distribution of latencies.
- Per-route and per-tenant views: A p99 spike at the global level is often caused by a single, heavy API route or one specific high-volume tenant.
- Exemplars (From a bucket to a trace): Modern observability tools allow you to click on a slow "bucket" in a histogram and see the specific Trace ID (exemplar) associated with that latency. This bridges the gap between "it's slow" and "here is the exact database query that hung."
- Before/after window comparison: Compare the current tail distribution to a "known good" window (e.g., 24 hours ago). Look for shifts in the count of requests hitting the 500ms+ range.
What is a good p99 latency?
According to [Redis], "good" latency depends entirely on the application. However, general industry rules of thumb are:
- Excellent: p99 < 100ms
- Strong: p99 < 500ms
- Acceptable: p99 < 1s Anything over 1s at the p99 for a user-facing API is usually considered a performance bug that will lead to perceived "lag" and frustration.
When to alert on p99 (and when not to)
You should alert on p99 for your most critical, user-facing routes. However, avoid alerting on p99 for background jobs or asynchronous workers where latency doesn't impact the user experience. Alerting on the "tail of the tail" (like p99.99) can often lead to "alert fatigue" because these metrics are naturally volatile.
FAQ: What is P90 vs p99?
- What is P90 and P99 latency? P90 means 90% of requests are faster than the value; it is a measure of "broad" performance. P99 is "edge" performance. If P90 is stable but P99 is climbing, you have an outlier problem (like GC or lock contention).
- What is P99 API latency? It refers specifically to the response time of an API endpoint. This is the most common metric used in Service Level Agreements (SLAs).
- How do I calculate p99? According to [Aerospike], the p99 latency formula involves sorting all latencies in a time window and picking the value at the 99th position of the 100th percentile.
Why this matters now
As systems become more distributed, tail latency amplification becomes a major risk. In a microservices architecture, a single p99 delay in a downstream service can propagate upward, turning a minor outlier into a sitewide slowdown.
Because tail regressions often happen without a code change, they are the hardest incidents to catch. This is where Operate changes the workflow. Operate’s proactive latency watch opens its own case the moment a route's p95 or p99 begins to drift—often before a human even notices the dashboard change. Its autonomous agent pipeline then traces the regression across code, database, and infrastructure, providing the evidence needed to fix the root cause before your heaviest users decide to churn.
Sources & further reading
- According to [Aerospike], p99 is the industry standard for measuring the stability of high-performance databases.
- According to [Redis], p99 latency is particularly critical for LLM and RAG applications where token generation speed is the primary user experience metric.
- According to [Jasmine Park], session math means a 1% request failure rate can impact 10% of users.
- According to [Stack Overflow], p99 is often used to exclude the "crazy" outliers while still capturing the real-world "slow" cases.