Measure Time to Diagnose as Its Own Incident Clock
Time to diagnose hides inside MTTR. Four timestamps to record per incident, what counts as a cause identified, and how to read the intervals honestly.
Quick Answer
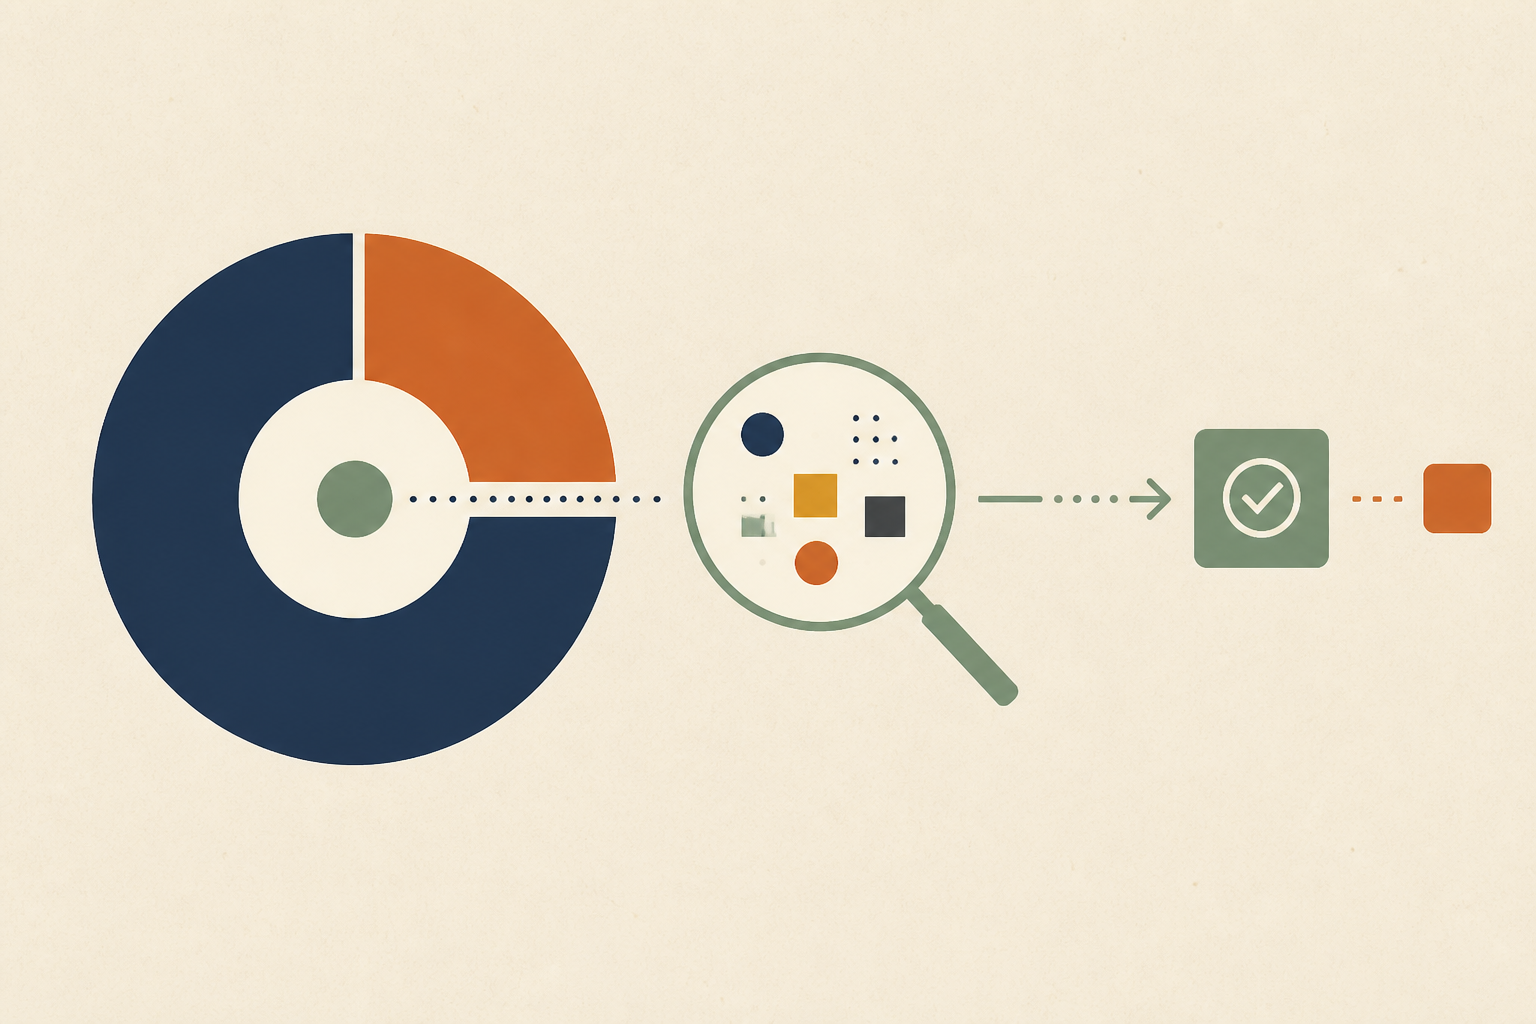
The stretch of an incident between a responder starting to investigate and the team naming a cause backed by evidence is the time to diagnose. It hides inside mean time to resolution, so a single number cannot say where the hours went. Capture four timestamps per incident, record each cause on its own clock, and read the intervals one incident at a time.
Time to diagnose is the part of an incident clock that most teams never measure. We see detection tracked by the monitoring system and resolution tracked by the ticket, while the hours in between disappear into a single average.
That gap matters because the work in it is different. Detection and repair are mostly tooling problems, and diagnosis is a search problem. If you cannot see how long the search took, you cannot tell which kind of investment would help.
This post defines the diagnosis clock, shows it on a real timeline, lists the four timestamps to capture, explains what should count as a cause identified and says how to read the numbers without fooling yourself.
One Incident Clock Hides Where the Time Went
Railway's incident report for 2 July 2026 publishes a clean timeline, which makes it a useful specimen. The outage lasted from 07:44 to 12:01 UTC, and the report marks the moments that matter.
| Time (UTC) | Event in the report | Interval since previous |
|---|---|---|
| 07:44 | Packet loss detected in the US East region | Start |
| 08:59 | Secondary carrier reconnected and routing stabilised | 75 minutes |
| 10:45 | Storage connections stuck on a slow management network identified | 106 minutes |
| 12:01 | All systems returned to normal levels | 76 minutes |
The total is 257 minutes, and a single MTTR figure would record exactly that. We read the table differently. After routing was fixed at 08:59 the system stayed degraded, and it took 106 minutes before anyone named the second cause. That interval is the diagnosis of a cause nobody had suspected, and it is larger than either the first repair or the final recovery.
The report does not label its intervals as diagnosis, so the split is our reading rather than Railway's. The point survives the caveat. An average would have folded those 106 minutes into one number, and no one would have known whether the next investment belonged in alerting, runbooks or tooling. We cover the failure class behind this incident in our analysis of stuck state at Railway and CircleCI.
Time to Diagnose Starts With Four Timestamps Per Incident
Measuring the clock needs very little. We would add four fields to the incident record and fill them in as the incident happens, not afterwards from memory.
1. Detected
The moment the system or a person first knew something was wrong. Use the earliest credible signal, not the moment the page was acknowledged, so that late acknowledgement does not shorten the apparent diagnosis time.
2. Investigation Started
The moment the first responder with relevant context began looking. The gap between detected and started is mobilisation. It belongs to a different clock, and mixing it in makes diagnosis look longer than it was.
3. Cause Identified
The moment someone states a cause and attaches the evidence that supports it. This is the timestamp teams find hardest to record honestly, so the next section sets rules for it.
4. Mitigated and Resolved
Two separate times. Mitigation is when users stopped being harmed, and resolution is when the system is back to normal. The interval after the cause is identified measures repair and recovery, not diagnosis.
Time to diagnose is then the interval between investigation started and cause identified. Because it sits between two human actions, it is only as reliable as the habit of recording them.
| Interval | What it measures | Who usually owns the fix |
|---|---|---|
| Detected to investigation started | Mobilisation, meaning paging, handover and getting the right person in | On-call design and escalation |
| Investigation started to cause identified | Diagnosis, meaning the search for a cause with evidence | Runbooks, telemetry and investigation tooling |
| Cause identified to mitigated | Repair, meaning applying a fix or rollback | Deploy and rollback tooling |
| Mitigated to resolved | Recovery, meaning the system returning to normal | Platform and capacity engineering |
The right-hand column is the reason to split the clock. Each interval has a different owner and a different kind of remedy, so one blended number sends every team to the same meeting.
We would capture the timestamps where the work already happens. The incident channel shows when a responder joined and when someone posted a cause with a link, and the deploy history shows when a rollback landed. A short template filled in at the end of each incident, with a reviewer who checks the evidence rule, is enough to start. It does not need a new tool, and a spreadsheet will hold the first fifty incidents without complaint.
Resist the urge to backfill old incidents from memory. Reconstructed times cluster around round numbers and flatter the team, so we begin the series with the next incident and accept a few quarters of thin data.
What Counts as a Cause Identified
A diagnosis clock is easy to game by accident. Someone says it is probably the database in minute five, and the clock stops, even though the real cause turns up an hour later. We would use three rules to keep the timestamp honest.
- A hypothesis does not stop the clock. A claim with linked evidence, such as a query result, a log line or a deploy diff, does.
- Each distinct cause gets its own entry. In the Railway timeline above, routing and stuck connections are two causes and two intervals.
- If a cause is later retracted, the clock reopens and the retraction is recorded, because a wrong diagnosis is part of the time spent.
One practical wrinkle is the incident that never gets a clean answer. Some outages end because a restart cleared the symptom, and nobody ever learns why. We record those as resolved with no cause identified, and we count them separately, because they are the incidents most likely to return and the ones where a diagnosis clock would otherwise show a flattering zero.
These rules cost a sentence of discipline at each step. They also make the data useful, because a diagnosis time that includes false starts tells you how expensive the search really was.
Where Diagnosis Time Actually Goes
The AWS whitepaper on availability and resilience is plain about this phase. "Part of the repair process after detection is the diagnosis period," says the section on reducing MTTR. It adds that the period involves querying logs, reviewing operational health metrics or logging into hosts, and that tools and runbooks which speed those actions reduce recovery time.
Once you have the interval, the next question is which of those actions ate it. We tag each diagnosis with where the evidence came from, such as a deploy history, a database view or a log search, so a pattern appears after a dozen incidents. If most of the time goes into assembling evidence across systems, that is the work we would hand to dedicated AI agents that investigate problems and cite their evidence, while a person keeps the verdict.
For the procedure itself, our guide on how to reduce MTTR by shortening diagnosis covers the order of checks. This post stays on the measurement.
Reading the Clock Without Fooling Yourself
A new metric can mislead as easily as the old one, and we would be wary of building a target on this one. Google's SRE team describes a report on incident metrics in SRE showing, through simulation, that MTTR and similar statistics are "poorly suited for decision making or trend analysis" for production incidents. The same caution applies to a mean time to diagnose.
So we use the diagnosis clock for questions, not for scores. Read the intervals incident by incident, and look at the longest few rather than the average. Our notes on the median versus the mean in outage data explain why the tail carries the information, and what a good MTTR target looks like covers why we avoid fixed targets.
• Small Samples
With a handful of incidents per quarter, one unusual outage dominates any summary. Compare incidents to each other and ignore quarterly averages.
• Incidents With No Single Cause
Some failures have a contributing set of causes and no moment of identification. Record the time the team agreed on the working explanation, and mark it as such.
• Quiet Gaming
Any metric that someone is judged on will drift. Keep this one out of performance reviews, and use it only to decide where to invest.
Record the Cause Timestamp at the Next Incident
Time to diagnose is worth measuring because it separates the search from the repair. Capture four timestamps, hold the cause timestamp to the evidence rule and review the longest intervals after each major incident.
We would start at the next incident, with a single new field in your template. When you want help gathering the evidence behind each cause, Operate runs dedicated AI agents that investigate production problems and propose fixes for your team to review.
Frequently Asked Questions
We define it as the interval between a responder starting to investigate and the team naming a cause with supporting evidence. It excludes detection and mobilisation before it, and repair after it, which is why it can show where an incident actually stalled.
We record four timestamps on every incident, namely detected, investigation started, cause identified and resolved, and then subtract the second from the third. The key is a firm rule that a cause counts only when evidence is attached, so a guess does not stop the clock.
We treat MTTD as the average time to detect a problem and MTTR as the average time to recover, though the R is used for several words. Diagnosis sits inside MTTR, which is why we measure it separately instead of expecting either average to reveal it.
We would suspect a long diagnosis first, especially when evidence is spread across systems or only one person understands a component. A second cause that appears after the first fix, as in the Railway timeline, can also double the clock.
We would not say so. A lower number can come from quick restarts that destroy evidence and raise how often incidents recur. We look at the longest incidents and at repeat causes before celebrating any average that falls, and we read the two together.
About the author

Operate Team
The team behind Operate
Operate Team builds Operate, enterprise AI agents for production operations. Operate answers production questions from Slack and Microsoft Teams, investigates alerts, and reviews performance, security and cost. It finds the root cause with evidence and proposes a fix for an engineer to review, with controlled access to your systems.