How to Reduce On-Call Alert Fatigue by Triaging First
On-call alert fatigue comes from pages that need no action and carry no evidence. Five steps to cut it without hiding real incidents, and how to measure it.
Quick Answer
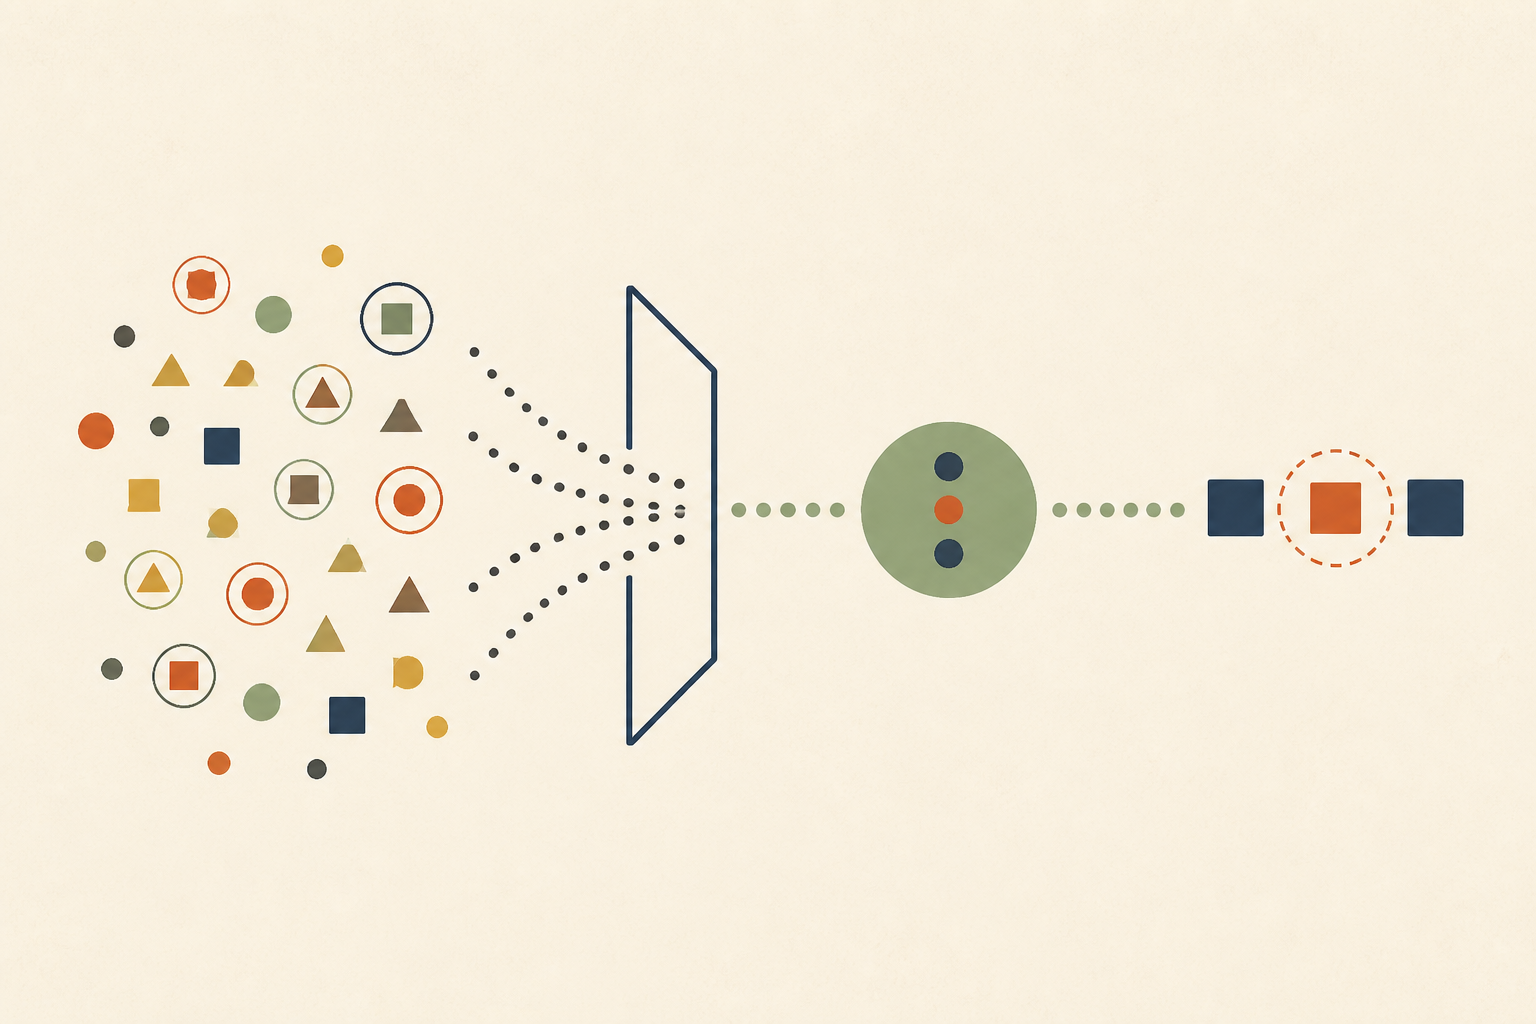
Pages stop meaning anything when most of them need no action, and responders start reacting slowly to all of them. Raising thresholds rarely fixes that, because the noise comes from paging on causes instead of user-facing symptoms and from sending humans alerts with no evidence attached. Audit every page, alert on symptoms and error budget burn, group related alerts, attach evidence before the page lands, and remove pages that only need a rote response.
On-call alert fatigue is the gradual loss of urgency that sets in when an on-call engineer receives more pages than they can treat as real emergencies. We see it in teams of every size, and it is almost always a design problem in the alerting, not a resilience problem in the people.
The usual response is to tune thresholds until the phone goes quiet. That treats the volume and leaves the cause, which is that most pages arrive without the evidence needed to decide if they matter.
In this post we cover what alert fatigue looks like, why threshold tuning falls short, a five-step way to reduce it with triage evidence, the metrics that prove progress, and when fewer pages is the wrong goal.
What On-Call Alert Fatigue Looks Like in Practice
Google's SRE book states the human limit directly in its chapter on monitoring distributed systems. "Every time the pager goes off, I should be able to react with a sense of urgency. I can only react with a sense of urgency a few times a day before I become fatigued."
The book's chapter on being on-call puts numbers on that ceiling. It estimates that handling one incident, including root cause analysis, remediation and the postmortem, takes about six hours, so the maximum is two incidents per 12-hour shift, and it suggests fewer than two paging events per shift as a measurable target.
Most teams with alert fatigue are far past that. The signs we look for are familiar.
- Pages acknowledged and closed within minutes with no change made.
- The same alert firing every night and resolving itself before anyone looks.
- Several pages arriving together for what turns out to be one problem.
- Engineers muting channels or silencing alerts for hours at a time.
Each of those teaches the responder that a page is probably noise, which is exactly the lesson that makes a real incident slow to land.
Why Threshold Tuning Alone Does Not Fix It
Thresholds are static and production is not. A CPU alert at 80% pages for a routine batch job, and the same alert raised to 95% misses a slow leak that fails at 94%. We can spend months moving that line and never find a value that is both quiet and safe.
The deeper problem is what the alert measures. CPU, queue depth and connection counts are causes, and a cause can be high without any user noticing. The Prometheus project's guidance on alerting practices puts it simply, keep alerting simple, alert on symptoms, and avoid pages where there is nothing to do.
Cause-based alerts also multiply. One bad deploy can raise an error-rate alert in the application, a slow-query alert in the database, a restart alert in Kubernetes and a failed-check alert in CI. The on-call engineer gets four pages for one problem and has to correlate them by hand at 3 a.m.
Five Steps to Reduce On-Call Alert Fatigue With Evidence
We reduce alert fatigue by changing what reaches a human and what arrives with it. These five steps work in order, and each one makes the next easier.
1. Audit Every Page for a Month
For four weeks we tag every page with what happened next. A simple scheme is enough, such as actionable, resolved itself, or no action needed.
The audit usually shows a small number of alerts producing most of the noise. Those are where the next steps pay off first, and the tags give the team evidence to delete alerts without arguing from memory.
2. Page on Symptoms and Error Budget Burn
We move paging to symptoms users feel, such as errors and latency against a service level objective, and demote cause metrics to dashboards and tickets. The SRE book's test for any paging rule is whether it detects a condition that is "urgent, actionable, and actively or imminently user-visible".
The SRE workbook chapter on alerting on SLOs shows how to tune these alerts against four properties, precision, recall, detection time and reset time. Burn-rate alerts over multiple windows page quickly for a fast outage and stay quiet for brief blips, which removes a large class of self-resolving pages.
3. Group, Inhibit and Route Related Alerts
We make one problem produce one notification. The Prometheus Alertmanager documentation describes the three mechanisms most teams need. Grouping combines alerts of a similar nature into one notification, inhibition suppresses alerts that another firing alert already explains, and silences mute known noise for a fixed time.
Inhibition is the most underused of the three. If a whole cluster is unreachable, every service alert inside it adds nothing, and one cluster-level page is the honest signal.
Routing matters as much as grouping. We send each notification to the team that owns the failing symptom, with the related cause alerts attached as context, so the first responder is someone who can act on what they see rather than someone who has to forward it.
4. Attach Evidence Before the Page Lands
This is the step that changes how a page feels. Instead of a bare alert that says latency is high, the notification arrives with the recent deploys, the error log lines from the affected service, the slow queries and the infrastructure events from the same window.
Teams can script this for their top alerts, or use an AI agent that investigates with evidence before a human is involved. Either way, the responder starts from a short list of likely causes instead of an empty dashboard, and a page with no supporting evidence becomes a candidate for demotion.
In our view this step changes the first minutes of an incident more than any other, because those minutes are usually spent gathering what a script could have gathered.
5. Remove Pages With Rote Responses
The SRE book is blunt about pages that need no judgement. "If a page merely merits a robotic response, it shouldn't be a page."
If the fix for an alert is always the same restart or cleanup, we automate the response and turn the alert into a ticket that reports what the automation did. If nobody can name the action an alert should trigger, we delete it.
Metrics That Show Alert Fatigue Is Falling
We track a few numbers from the first audit onwards, so the team can see which changes help. Raw page count alone can mislead, because a quiet week may simply be a quiet week.
| Metric | How we measure it | Direction we want |
|---|---|---|
| Pages per on-call shift | Count of paging notifications, per shift | Down, towards fewer than two |
| Actionable page rate | Pages that led to a change, divided by all pages | Up |
| Self-resolving pages | Pages that cleared before anyone acted | Down |
| Time from page to first evidence | Minutes until the responder knows where to look | Down |
| Out-of-hours pages | Pages between the team's working hours | Down |
We also ask the rotation directly, once a month, how many pages felt worth waking up for. That answer usually moves before the numbers do.
When Fewer Pages Is the Wrong Goal
Cutting pages is a means, not the target. Some systems page too little, and the result is worse than fatigue.
Symptom-based alerting depends on measuring what users see. If a job silently stops producing output, or an API returns 200 with an empty body, no symptom alert fires, and we cover how to catch that in detecting silent failures with external expectations.
Rotations that are already burnt out are a further case. Removing noise helps, but a team that has absorbed months of bad pages may need time off the rota and a lighter schedule before any metric moves, and we treat that as part of the fix.
New services are another exception. We accept noisier alerting for the first weeks of a launch, while the team learns what normal looks like, and tighten it once the audit data exists.
Finally, alert design is only half of the problem in high-stakes settings. Medicine has studied alarm fatigue for years, and we compare its lessons with ours in alert actionability lessons from emergency medicine. Deciding how severe an alert is under uncertainty is its own skill, which we cover in incident severity levels.
Treat On-Call Alert Fatigue as a Triage Problem First
We would begin with the audit, because it turns opinions about noisy alerts into a list. Then move paging to symptoms, group what belongs together, and make every remaining page arrive with its evidence.
Done in that order, on-call alert fatigue can fall without hiding real incidents, because the pages that remain carry their own reasons. That evidence-first triage is what Operate was built for, with investigations that can start from an alert webhook or a question in Slack or MS Teams and read only the evidence the incident needs.
Frequently Asked Questions
Alert fatigue is the loss of responsiveness that follows too many alerts, especially ones that need no action. We see responders begin to treat every page as probable noise, which slows the response to real incidents. It is a property of the alerting design, not a weakness in the people on call.
We find three causes most often. Alerts fire on internal causes rather than user-facing symptoms, one problem triggers several separate pages, and alerts arrive without the evidence needed to judge them. Static thresholds that page for routine spikes add steady background noise on top of all three.
We start by auditing every page for a month and tagging what happened next. Then we page on symptoms and error budget burn, group and inhibit related alerts, attach evidence to each notification, and automate or delete any page whose response is always the same.
Automation helps in two places. We use it to gather evidence before a human is paged, so the responder starts with logs, deploys and queries in hand. We also use it to handle rote fixes, turning pages that need no judgement into tickets that report what was done.
The two describe the same effect in different settings. We use alarm fatigue for clinical environments, where staff become desensitised to monitor alarms, and alert fatigue for software operations, where engineers become desensitised to pages. The remedies overlap, especially reducing non-actionable signals and adding context.
About the author

Operate Team
The team behind Operate
Operate Team builds Operate, enterprise AI agents for production operations. Operate answers production questions from Slack and Microsoft Teams, investigates alerts, and reviews performance, security and cost. It finds the root cause with evidence and proposes a fix for an engineer to review, with controlled access to your systems.