Silent Failures in Software and the 2003 Blackout Alarm
In 2003 a control room alarm system stalled without a trace and its backup inherited the stall. The same failure mode lives in cron jobs, queues and alerts.
Quick Answer
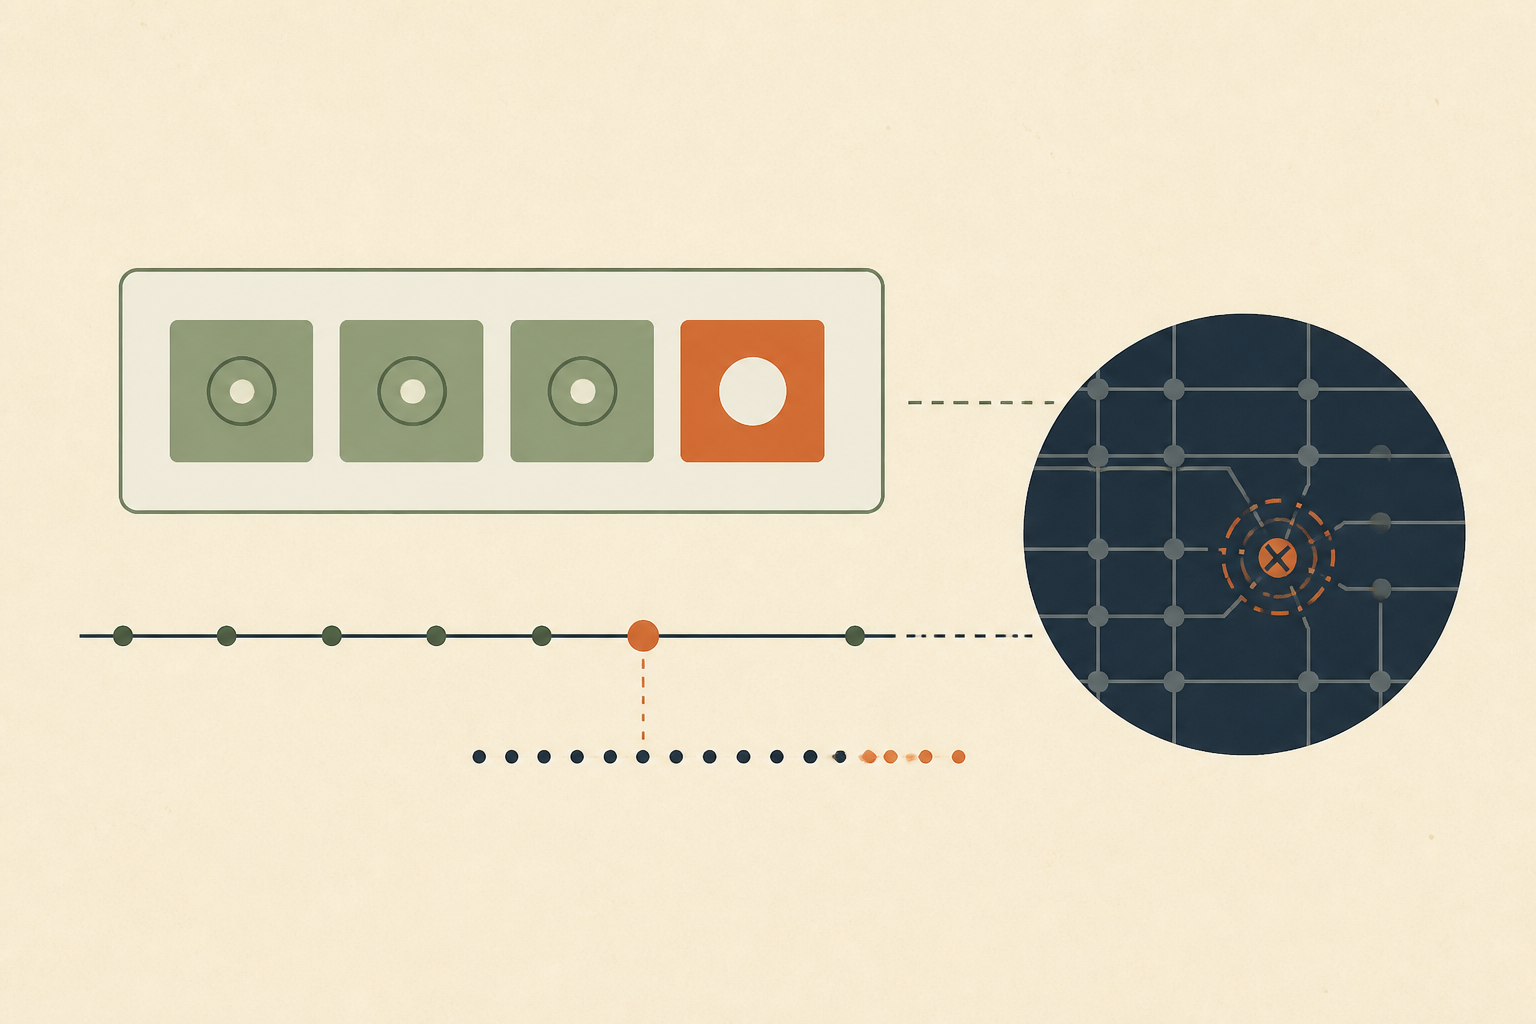
Silent failures in software happen when a component stops doing its job without any error, alert or crash. In the 2003 Northeast blackout, the alarm function at a utility control room stalled around 2:14 PM, its backup inherited the stall and operators had no sign anything was wrong. The same pattern lives in cron jobs, queues and alert pipelines. Alarm on the alarm system, and verify it after every restart.
On 14 August 2003, large parts of the Midwest and Northeast United States and Ontario lost power. The US-Canada Power System Outage Task Force's final report says the outage affected an estimated 50 million people. Much of the public story concerned overgrown trees and overloaded lines.
The report also describes a quieter failure in a control room in Ohio, where the alarm function stopped without anyone noticing. We think that story is one of the clearest descriptions of silent failures in software, because the screens kept working while the warnings stopped.
August 14, 2003 and the Alarm That Never Sounded
We take the facts from the Task Force's final report, which sets out the control room timeline in its second phase. It says the alarm and logging software at FirstEnergy, referred to as FE, failed shortly after 14:14 EDT, and that neither the control room operators nor the IT support staff were aware of it.
| Time (EDT) | Event in the Task Force report |
|---|---|
| 14:14 | FE alarm and logging software fails; nobody is aware |
| 14:20 | Several remote EMS consoles fail and the IT engineer is auto-paged |
| 14:32 | A neighbouring utility calls about a line trip that FE has no alarm or log of |
| 14:41 | The primary server hosting the alarm function fails and passes its work to a backup |
| 14:54 | The backup computer fails and everything running on it stops |
| 15:08 | IT staff restart the primary server, but the alarm system remains frozen |
The report says that for over an hour no one in the control room grasped that their computer systems were not operating properly, even though the IT staff knew of problems and were working on them. The control room saw no alarms because the alarm function was not working.
Operators Trusted a Screen That Had Gone Quiet
The rest of the energy management system kept collecting real-time measurements and sending them on to other authorities. Operators did not know they needed to monitor those measurements more closely by hand. The report says they believed the system was satisfactory because no alarms said otherwise.
They were then surprised by telephone calls from other organisations that had accurate information about FE's lines. We read this as the psychological hazard of a silent failure. When the monitoring layer fails quietly, it does more than leave you without information, because the absence of alarms reads as good news.
The Backup Inherited the Stall
FE had a hot-standby server for exactly this case. The report explains that when the primary server failed at 14:41, the alarm application and the other software on it failed over automatically. However, because the alarm application moved intact onto the backup while still stalled and ineffective, the backup server failed 13 minutes later.
That is shared fate in its plainest form. Failover copies the state along with the function, so a stalled process is moved and not repaired. Our piece on redundancy without diversity on Ariane 501 describes the same lesson in another industry.
The Anatomy of Silent Failures in Software
We use silent failure to mean a failure in which a component stops performing its function and none of the existing monitoring, error handling or alerting notices. It differs from a hard crash, which emits an error, and from a noisy failure, which fills the logs.
- Functional cessation. The core logic stops working correctly.
- An observability gap. Process-up, CPU and memory checks remain normal.
- Stale state. The system keeps serving old data or success responses while its internal state is broken.
Key Takeaway. The most dangerous failures do not page you at night. They stop working quietly while the dashboards stay green.
Your Stack Has the Same Failure Mode in Four Places
We do not run transmission lines, and modern stacks still have the same shapes of silence.
• Dead Alert Pipelines
Alerting is a pipeline of collector, rules engine and notification channel. If a credential expires or the rules engine stops evaluating, the system can fail while the alert pipeline reports no incidents.
• Cron Jobs That Exit Zero and Do Nothing
A scheduled task that catches its own exception, logs it and exits with success looks healthy to the scheduler. The database is never updated, and the last successful run metric is misleading. Our piece on why exit zero is not evidence a batch job worked covers it.
• Queues Draining to Nowhere
A consumer that acknowledges a message before it is processed makes queue depth look healthy while data is lost. Only an end-to-end freshness check will notice.
• Exceptions Swallowed at the Boundary
A service can return success with an empty body when the underlying fetch failed. If the caller does not validate the response, the failure travels the whole way to the user.
Four Lessons From the Task Force Report
The report supports four lessons, and we have kept each close to what it says.
- Alarm on the alarm system. The report says an alarm system can be set up to alarm operators if it fails to perform properly, and that "FE's EMS did not have such a notification system."
- Verify after every restart. IT staff restarted the primary server at 15:08 and its start-up diagnostics showed the expected processes running, yet the alarm system stayed frozen. The report says they did not confirm that the alarm system was working with the control room operators.
- Do not rely on a backup that copies the fault. The stalled application moved intact to the backup, which then failed too.
- Weigh outside signals. Calls from neighbouring organisations carried accurate information. Customer reports and external probes play the same role for a software service.
Google's SRE book defines black-box monitoring in its chapter on monitoring distributed systems as "Testing externally visible behavior as a user would see it." It is the cheapest outside signal to add. When a probe does fail, dedicated AI agents that investigate with cited evidence can help gather the context while engineers decide, and Prometheus's alerting practices page discusses monitoring the monitoring system itself.
An Audit Checklist for Silence
We would work through these questions for each critical service.
- Do critical scheduled jobs raise an alert when they do not run, and not only when they fail?
- Does an API return an error, and not an empty success, when a result set is unexpectedly empty?
- Does an alert fire if log ingestion volume drops sharply?
- Do external black-box probes mimic real user journeys?
- Do services reject malformed input, or silently ignore it?
Pushing a known synthetic failure through the alert path on a schedule proves the whole route works, from the code to the responder's phone. Our guide to detecting silent failures from outside the system goes into the method.
Where the Blackout Analogy Stops
The alarm failure was one of several causes the Task Force identified, and the report separately discusses inadequate tree trimming, inadequate situational awareness and other causes. We are not claiming that a software stall alone caused a continental blackout.
A utility control room is also not a software service. Operators there depended on calls from neighbouring control rooms in a way most services do not. We use the case as a vivid example of the pattern and not as a model of your architecture.
Audit Your Silent Failure Points Before Your August 14
Silent failures in software hide behind healthy-looking dashboards. Alarm on your alarms, verify after every restart, keep backups independent and treat a sudden drop in errors as a signal to check the instruments.
We would start by adding one external probe and one heartbeat to your most critical service this week. When you want help investigating once something is flagged, Operate runs dedicated AI agents that investigate production problems with cited evidence and propose fixes for your team to review.
Frequently Asked Questions
We define it as a failure where a component stops doing its job and no monitoring, error handling or alerting notices. Process-up checks and resource metrics stay normal, so the system looks healthy while it serves stale data or does nothing.
The Task Force report names several causes, including inadequate situational awareness at the utility. We focus on one part, a stalled alarm process that left control room operators without alarms for over an hour, while the backup server inherited the problem.
We use checks from outside the failing system, such as black-box probes, heartbeats for jobs that must run, freshness checks on data and an alarm on the alerting pipeline itself. Each one looks for an absence that internal metrics cannot show.
We mean an alert that fires when an expected signal stops arriving, such as a heartbeat from a job. It reverses the usual logic by treating silence as the failure, which makes it a direct check for a stalled system.
We note that failover moves work to a standby, and it moves the state with it. If the fault lives in that state or in shared code, the standby fails the same way, as the backup server did in 2003, 13 minutes after taking over.
About the author

Operate Team
The team behind Operate
Operate Team builds Operate, enterprise AI agents for production operations. Operate answers production questions from Slack and Microsoft Teams, investigates alerts, and reviews performance, security and cost. It finds the root cause with evidence and proposes a fix for an engineer to review, with controlled access to your systems.