Enterprise AI for production operations
Keep production running. Give your engineers time to build.
Operate brings dedicated AI agents and context from your connected systems together to monitor production, investigate problems, and propose fixes for your team to review.
Self-hosted deployment. Controlled access. Engineer-reviewed changes. Deploy it yourself
MongoDB · production cluster
Illustrative
- Errors agentNo new error patterns since the last check
- Performance agentorders queries scanning the full collection after today's deploy
- Security agentapp-readonly role can also write to two collections
- Cost agentUnused index on events.created_at adds 38 GB
Investigating: performance finding, with deploy and application context. Proposed fix will go to an engineer for review.
How Operate works
Monitor, investigate, propose, review.
01
Monitor
Dedicated agents check defined aspects of each connected system: errors, performance, security, and cost.
02
Investigate
When a finding, an alert, or a question needs attention, Operate brings the relevant evidence together across your environment.
03
Propose
Findings come with recommended next steps, and a proposed patch where a code change is the fix. Not every finding needs one.
04
Review
Engineers decide what changes. Operate's built-in agents cannot commit, merge, or deploy.
Agents run their checks proactively. Investigations can also start from an alert webhook (Datadog, CloudWatch, Slack) or a question asked in Slack or MS Teams.
Agents
Dedicated agents for the systems your software depends on.
An integration gives Operate access to a tool. A dedicated agent does a defined job with that access. When you connect a tool, purpose-built agents watch four aspects of how your software uses it.
Browse the agent directory- MongoDB Errors agent
- Failed operations, write errors, and connection failures coming from your application.
- MongoDB Performance agent
- Slow queries, missing or unused indexes, and collection scans as data grows.
- MongoDB Security agent
- Users, roles, and network exposure that grant more access than your software needs.
- MongoDB Cost agent
- Storage growth, oversized clusters, and indexes that cost more than they return.
Example checks. Each agent's exact checks depend on your setup.
Context layer
Each agent knows its job. Operate connects the wider picture.
A finding from one tool often needs context from others: a database slowdown may trace back to a deploy, a configuration change, or a shift in application behaviour. Operate connects those systems into a shared context layer, and each investigation reads only what is relevant from it.
Each source you connect gives Operate more to work with. Not every source matters for every incident, and more sources do not guarantee a correct answer, which is why every finding cites its evidence.
Connected systems
read-only adapters
Shared context, agents and investigation
each reads only what its job needs
Findings and proposed changes
evidence cited, patch for review
- What changed?
- Code and deploy historyGitHubGitLab
- What happened?
- LogsDatadogCloudWatchGCP Cloud LoggingSolarWinds
- What state is the data in?
- Databases, read-onlyPostgreSQLMySQLMongoDB
- Who noticed?
- Alerts and questionsDatadog alertsCloudWatch alarmsSlackMS Teams
Illustrative example
From “what broke?” to “here’s what to change.”
One investigation, step by step: how Operate connects evidence across systems to reach a finding and a proposed fix. The systems, data, and timings here are illustrative, not from a customer.
How incident investigation works- 1
Signal
An alert fires and a customer reports failed checkouts
Datadog reports p95 latency on
checkout-apiat 2.4s against an 800ms threshold. Ten minutes later, support asks Operate what is going on. - 2
Context
Operate pulls only the context this incident needs
- Logs · Datadog412 slow-query warnings from checkout-api on the orders table since 14:05
- Code · GitHubThree merges to main in the last two hours, including migration 0142
- Database · Postgres replicaIndex list and query plan for the checkout query on orders
Other connected systems were not queried because nothing pointed to them.
- 3
Evidence
Possible causes are checked against the evidence
- Ruled outTraffic spike. Request volume matches the same hour last week.
- Ruled outPayment provider latency. Outbound provider calls show no change in p95.
- SupportedMissing index after migration 0142. Query plan switched to a full table scan at 14:04.
- 4
Finding
A root-cause finding, with its evidence and what is still uncertain
Migration 0142 dropped
idx_orders_account_id. Every checkout now scans the full orders table. A second model checked this finding against the cited evidence.Still uncertain: whether other queries on
orders.account_idare affected. Review the replica's slow query log after the fix. - 5
Patch
A proposed patch, as a file
+++ migrations/0143_restore_orders_account_index.sql +CREATE INDEX CONCURRENTLY idx_orders_account_id + ON orders (account_id); - 6
Review
An engineer reviews and decides what ships
Operate cannot commit, merge, or deploy. An engineer reads the evidence, applies the patch, and ships it through the team's normal process.
Custom agents
Start with dedicated agents. Add your own operational knowledge.
- When to build one
- When your team has operational knowledge no ready-made agent covers: an internal service, a business rule, a check you run by hand today.
- What it reuses
- The tools you have already connected and Operate's shared investigation context.
- How access is controlled
- Your team decides which connected tools and permissions each custom agent gets.
- How it ships
- Build and deploy it with the self-serve builder inside your Operate deployment.
Developers · early access
Extend coverage through an agent ecosystem.
Specialists know how a particular tool fails in production. Operate's architecture lets third-party developers package that expertise as agents that enterprises can run alongside their own.
A small group of developers is building agents with us in early access. There is no public marketplace yet.
Security and control
Expand automation without losing control.
- Self-hosted
- A Docker Compose stack (web UI and API on port 8080, worker, scheduler, MongoDB, Redis) on any cloud or your own hardware.
- Built-in agents are read-only
- Adapters read logs, databases, and repositories. Operate cannot commit, open pull requests, merge, or deploy.
- Custom agent access
- Custom agents get only the connected tools and permissions your team grants them. Review what each one can do before deploying it.
- Engineer review
- A .patch file plus the evidence behind the finding. An engineer reviews and applies it. A separate agent on a different model checks each proposed root cause against the evidence. This reduces unsupported conclusions; it does not guarantee correctness.
- Auditable
- Every agent's reasoning and every query it runs is logged and visible to your team.
- Your model, your data flow
- Bring your own model: Anthropic Claude, OpenAI or Azure Codex, an enterprise model, or a self-hosted open-source LLM. With a model hosted in your network, investigation data stays there. With an external AI provider, the context an investigation needs is sent to that provider. Operate itself receives only a usage record for billing: App ID, token counts, timings, and model name.
Pricing
Run it yourself, or have us run it.
Self-serve is a monthly platform fee plus usage. Usage is billed per token at one of two rates, depending on whether you use Operate's model or your own. With your own model, your provider also bills you for its tokens; that charge is separate from Operate's.
Self-serve
$99/mo
platform fee, plus usage
- Full investigation pipeline, alert-driven and on demand
- Slack and MS Teams, read-only integrations
- Deploy with Docker in your own infrastructure
- Read-only access, fully auditable
Usage rates
- Operate Managed LLM: $4.50 / 1M input · $22.50 / 1M output
- Bring Your Own LLM (your API key or self-hosted): $1.50 / 1M input · $7.50 / 1M output
Managed production operations
Priced on enquiry
Operate's engineers run Operate in your environment and work with your team on production issues.
- We deploy and operate Operate inside your cloud
- We review findings and patches with your team before anything is applied
- Billed monthly, no long-term contract
Questions
The things engineers ask first.
On its own, an AI model can't see your logs, your database, or your code history. Operate is the layer that connects to all of them safely, plus the agents that turn what they find into a verified answer.
One agent proposes a root cause with specific evidence; a separate agent on a different model checks it against that evidence. This reduces unsupported conclusions but does not guarantee correctness, so an engineer reviews every finding and patch.
Nothing. All adapters are read-only, including repository access. Operate can't commit, open pull requests, merge, or deploy. It generates a .patch file that an engineer reviews and applies manually.
A Docker Compose stack on any cloud or your own hardware, read-only credentials for the systems you connect, and a model: Operate's, or your own. Start with one log source and one repository, then evaluate it on an incident your team already understands.
You can keep using the product as long as you have a positive credit balance. The subscription fee is only one way to maintain access; prepaid credit works too.
No. Credit is valid for the lifetime of your account and never expires.
Public investigations
See Operate work on real open-source issues.
Operate reads the code of public GitHub and GitLab repositories and traces the root cause of open issues. Free, no sign-up.
From the blog
Field notes on RCA, observability, and shipping AI safely.
Managed SRE Services Should Answer Who Owns Production Work
Compare managed SRE services by the work they own, coverage, permissions and handoffs. Use a responsibility matrix before choosing a provider.
Can Your AI SRE Explain Yesterday’s Feature-Flag Decision?
Evaluate AI SRE tools with five feature-flag evidence tests. Check historical accuracy, honest uncertainty and review effort before a production pilot.
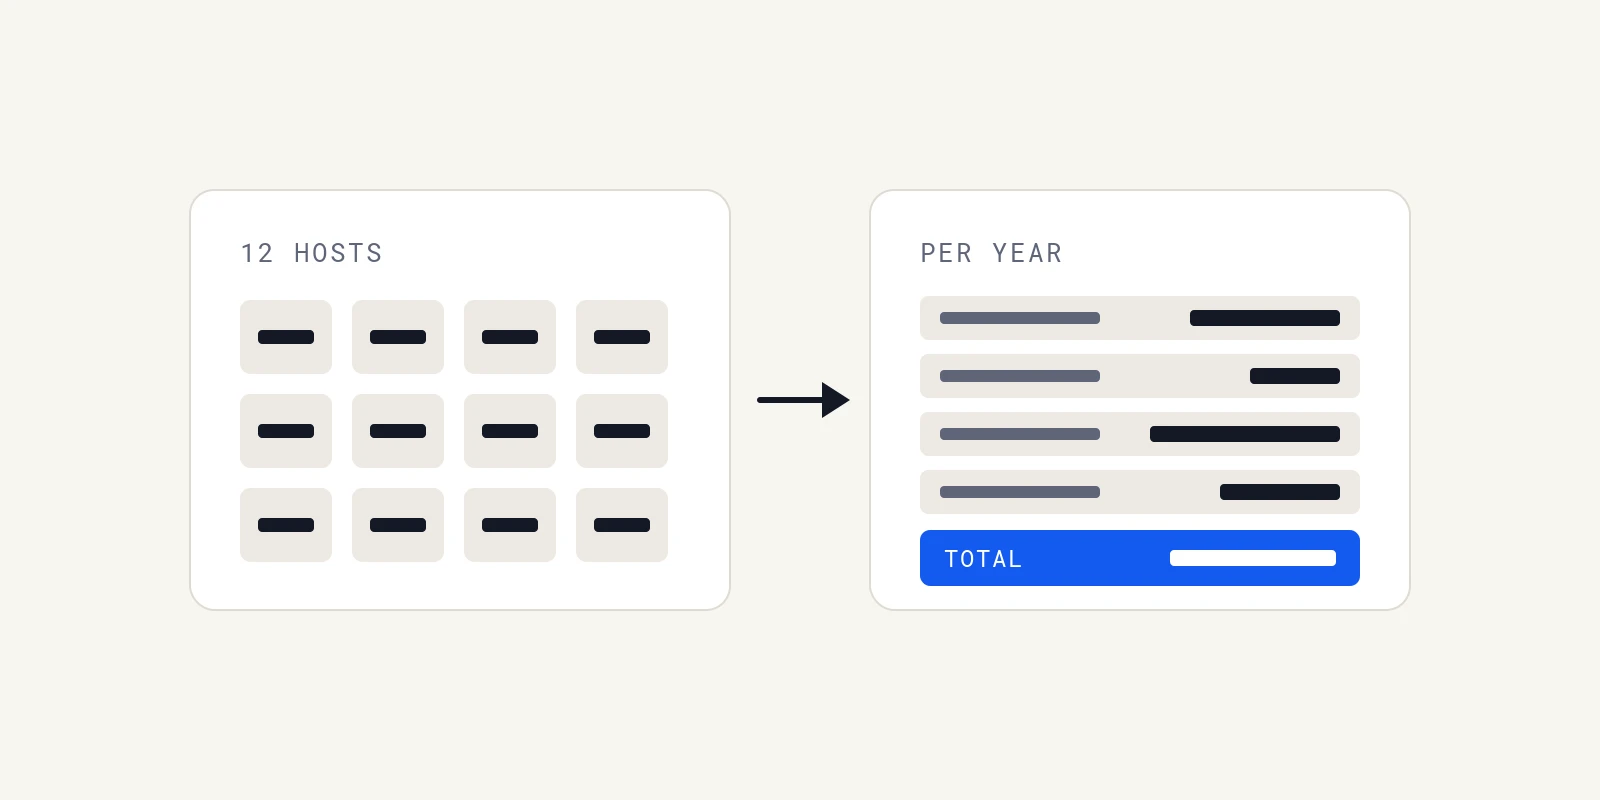
How Much Do Database Monitoring Tools Cost for a Team With 12 Database Hosts
We priced database monitoring tools for 12 hosts from six vendors' own pages, then listed the costs the per-host price leaves out.
Start with an incident your team already understands.
Connect the relevant systems and evaluate Operate's evidence, finding, and proposed fix against your team's investigation.