The GitHub Outage in August Was Capacity, Not a Change
GitHub says neither August 2026 outage came from a code or config change. What the root cause shows and how to add a saturation branch to your triage.
Quick Answer
GitHub's August 17, 2026 outage lasted 7 hours 47 minutes, and its CTO wrote that neither it nor the August 6 Actions incident was caused by a code or configuration change. Both were capacity failures, while monthly commits grew from 1.4 billion to 2.9 billion since April. For responders, the lesson is to ask what is full alongside what changed, because a change-first triage finds nothing when demand itself is the cause.
The GitHub outage of August 17, 2026 took down GitHub.com, authentication, Actions, APIs, pull requests, issues and Copilot for most of a working day. We think the most useful line in GitHub's own account is not about the duration. It is the statement that nothing changed.
Most incident triage starts by asking what was deployed or reconfigured. That habit is usually right, and on August 17 it would have found nothing, because the trigger was traffic reaching a new peak.
This post covers what GitHub said, the mechanism in its root cause analysis, why change-first triage stalls, how to add a saturation branch, why shipped clients belong in your blast radius, and when change-first is still the right opening.
What the GitHub Outage Postmortem Actually Says
GitHub's CTO Vladimir Fedorov published an account of the August 17 outage. We read it closely. It says the outage lasted 7 hours and 47 minutes, followed an Actions failure on August 6, and began when traffic reached a new peak and a critical infrastructure component in the Central US data center failed to scale with it.
The key sentence is short. "Neither outage was caused by a code or configuration change," Fedorov wrote, adding that both incidents were capacity failures at their core. He puts the pressure in numbers, with monthly commits growing from 1.4 billion to 2.9 billion since April.
The status page root cause analysis adds detail. The impact ran from 13:28 to 21:15 UTC, web and API error rates peaked around 20 percent and archive and raw-content downloads around 50 percent. SAML and OIDC authentication, SCIM and Team Sync were also affected.
The Mechanism Was a Limit the Autoscaler Did Not Watch
The root cause analysis describes a chain we think every platform team should read closely. The immediate cause was network saturation on load balancers in Central US due to a new peak in traffic.
It began with an Istio sidecar reaching its concurrency limit and failing to autoscale, because a misconfigured policy watched the host service but not the sidecar limits. One failure cascaded to more, until four HAProxy nodes exhausted their flow limits, degrading the gateway authentication path and causing widespread authentication latency and failures. Optimistic retry logic made it worse by overloading internal load balancers.
The lesson is the gap between what scales and what saturates. The autoscaler was watching a healthy number while the real limit filled up beside it, which is why we put that gap at the centre of the saturation check below.
A Change-First Triage Finds Nothing When Nothing Changed
Most incident protocols open with the same ritual. Check recent deploys, audit configuration changes and look at feature flags. We start there too, because most incidents really are change-induced.
When the cause is saturation, that ritual returns nothing. A responder who assumes they missed something widens the time window, pulls in the release engineer and rechecks the pipeline. Time goes into proving a negative while the system stays saturated.
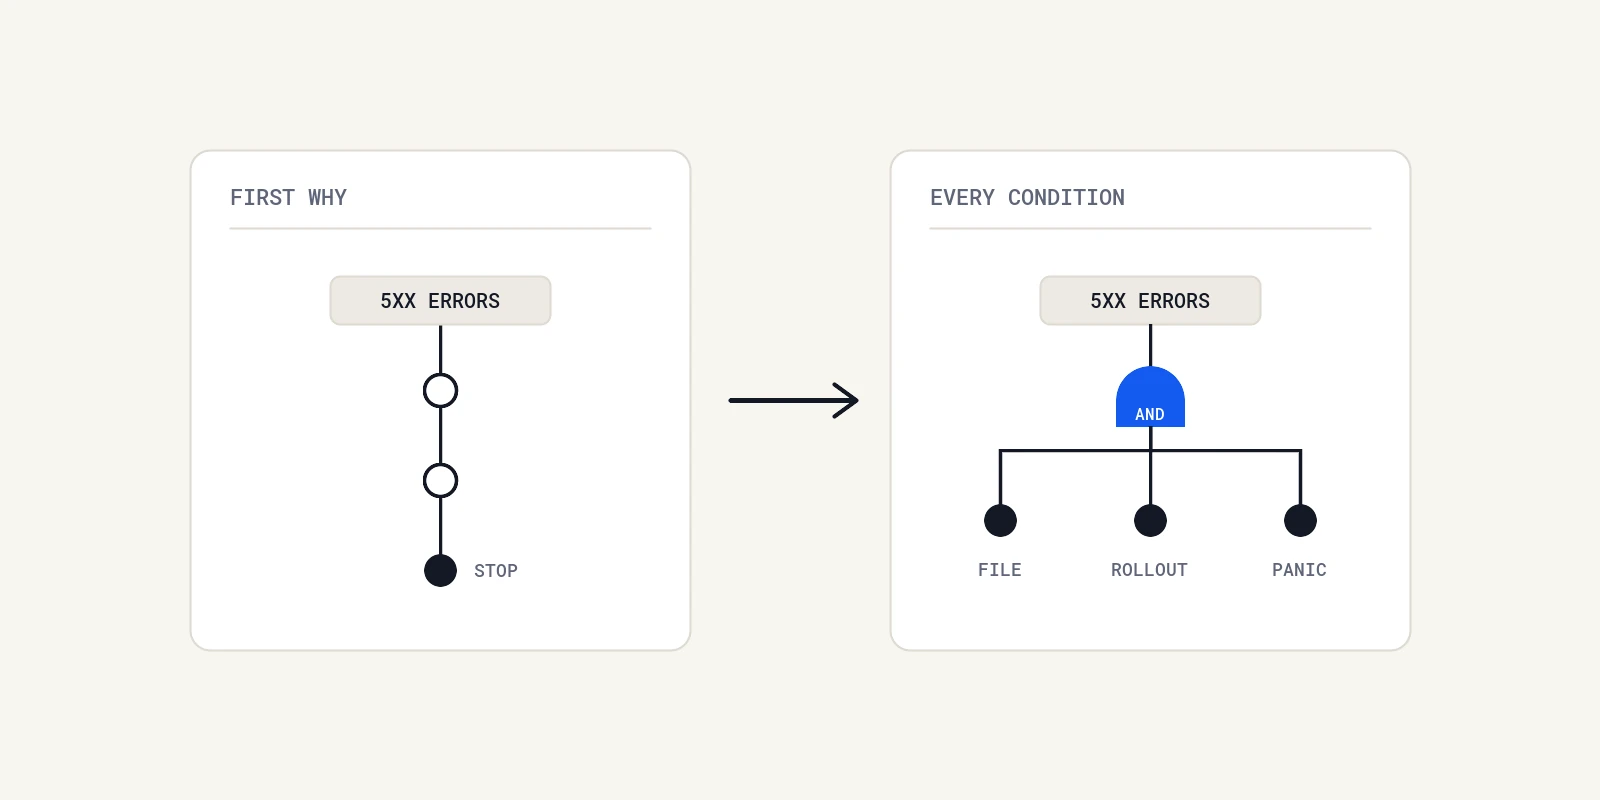
The absence of a change is itself evidence. If the first pass finds no deploy, flag or configuration change near the onset, we treat that as a prompt to open the saturation branch rather than to dig deeper into the change log.
Add a Saturation Branch to the Start of Every Triage
A saturation-first opening asks what is full, either before or alongside what changed. That means going past CPU and memory, because the limits that fail first are often ones no dashboard shows by default.
We would map, for every hop in the request path, the resource that actually limits throughput, where its utilisation is visible and what the autoscaler watches. GitHub's incident is the reason for the third column.
| Hop | Limiting resource | Where utilisation is visible | What the autoscaler watches |
|---|---|---|---|
| Ingress or load balancer | Flow or connection limits per node | Load balancer metrics, often not alerted on | Often nothing, or request rate |
| Service mesh sidecar | Sidecar concurrency limit | Mesh proxy metrics | Frequently the application container only |
| Application | Worker or thread pool depth | Runtime metrics, queue length | Usually CPU |
| Database client | Connection pool slots | Pool metrics, borrow wait time | Rarely watched by any autoscaler |
| Consumers | Queue depth and consumer lag | Broker metrics | Sometimes lag, often CPU |
The rows are a template, not a claim about any particular stack. The useful exercise is filling in your own, because any row where the last two columns disagree is a place where a saturation incident can grow while autoscaling reports everything as fine.
In practice we would add three questions to the opening of the runbook, next to the change checks.
- Which limiting resource is closest to its ceiling right now, and on which hop?
- Did demand reach a new peak in the hour before onset?
- Is any retry path multiplying traffic against the saturated hop?
Our post on Kubernetes requests and limits covers the related problem of capacity settings nobody reviews.
Your Blast Radius Includes Clients You Already Shipped
Recovery on August 17 was slowed by a client GitHub ships but does not control at runtime. According to the root cause analysis, delayed replies from one internal endpoint triggered a latent retry bug in VS Code that amplified traffic by about ten times and delayed recovery of the Copilot Token Service, whose traffic rose from a normal 7 to 9 thousand requests per second to 70 to 100 thousand.
GitHub could not patch the installed clients mid-incident. It reduced gateway authentication retries and blocked retry-triggering token requests at the load balancers with a 403, then ramped traffic back up per site. Its follow-up list includes addressing the VS Code retry behaviour and reviewing retry limits and backoff across gateways and clients.
If you ship an SDK, a mobile app or an IDE extension, your recovery behaviour runs on machines you do not control. We would make sure three server-side controls exist before the incident, the ability to shed a specific retry class, backoff signalled by the server that clients honour, and a retry budget enforced at the gateway. Google's SRE book chapter on handling overload describes per-request and per-client retry budgets and client-side throttling, and our post on retry storm amplification shows how to measure the multiplier.
Treat Capacity as a Root Cause Class, Not a Planning Cycle
When demand comes from automated workflows and coding agents as well as people, it stops tracking headcount. GitHub's response shows the scale involved. Fedorov reports more than 3 million CPU cores and 120 petabytes of high-speed storage added, and Azure serving roughly 58 percent of platform load, up from 12 percent in May.
He also lists two immediate changes, consistent retry limits, retry budgets and variable timeouts across service-to-service calls, and a review of lower-priority CPU and memory alerts to find components that could fail during sudden spikes. We read that second item as an admission that some saturation signals existed but were not treated as urgent.
For most teams, the practical version is to treat a projected exhaustion date as an incident precursor rather than a planning note. Teams can use agents that run proactive checks on performance and cost to surface a resource trending toward its limit before it pages anyone, but the key step is deciding who acts on the trend.
Most Incidents Are Still Caused by Changes
We are not suggesting anyone stop checking deploys first. Across most teams, a recent change is still the most common trigger, and the change log is the fastest place to look.
The argument is narrower. A triage that can only find a broken commit will stall on the incidents where demand outgrew a limit. Running the saturation questions in parallel costs a few minutes, and on a day like August 17 it saves the hour spent proving that nothing changed. Our guide to telling a provider outage from your own uses the same parallel structure.
Four Steps to Take After Reading the GitHub Outage Postmortem
You do not need GitHub's traffic for this to apply. We would take four steps this quarter.
- Map the limiting resource on every hop and compare it with what your autoscalers actually watch.
- Add a saturation branch to the opening of your triage runbook, next to the change checks.
- List every client you ship that retries, and confirm you can shed or slow those retries from the server.
- Track demand growth per surface and give each projected exhaustion date an owner.
The GitHub outage is a reminder that success can saturate a system as surely as a bad deploy. When it happens to you, Operate runs dedicated AI agents that investigate root causes with cited evidence and propose fixes for engineers to review.
Frequently Asked Questions
GitHub says it was a capacity failure, not a code or configuration change. We read the root cause analysis as a sidecar concurrency limit the autoscaler did not watch, leading to load balancer saturation in Central US, made worse by optimistic retries and a VS Code retry bug.
GitHub reports the outage lasted 7 hours and 47 minutes, from 13:28 to 21:15 UTC on August 17. We note that most services recovered earlier, around 16:36 UTC, while Actions and the Copilot Token Service took longer to return to normal.
GitHub publishes incidents on its status page, and its CTO described August 17 as the second significant incident that month. We would use that status history, filtered to the services you depend on, for your own risk planning rather than any single headline figure.
Check githubstatus.com, which lists current incidents by service, and compare it with the error rates your own integrations see. We trust our own telemetry first, because status pages are updated by people and can lag the start of an incident.
A retry storm is a surge of repeated requests from clients retrying failed calls, which adds load to a system that is already struggling. We saw one in GitHub's incident, where Copilot token traffic rose about ten times because of a client retry bug.
About the author

Operate Team
The team behind Operate
Operate Team builds Operate, a self-hosted AI SRE that reads your logs, databases and code to find the root cause of production issues with evidence, then drafts the fix as a patch for an engineer to review. Operate runs in your own infrastructure with read-only access to your systems.