Is AWS Down or Is It Us, Answered in Fifteen Minutes
Is AWS down, or did you break it? Status pages trail impact by an hour. A five-step protocol to settle attribution in the first fifteen minutes of an outage.
Quick Answer
Fifteen minutes of your own evidence usually settles if an outage belongs to AWS or to you, while provider status pages can trail the impact by an hour. Rule out the last change, read the shape of the symptoms, compare internal health with external probes, check the vendors that depend on the same provider, and then choose between a rehearsed workaround, a failover, or communicating with customers and waiting.
"Is AWS down, or is it us?" is the first question in many incident channels when errors spike with no recent deploy. Answering it is attribution triage, the work of deciding which side of a provider boundary a failure sits on before anyone starts changing things.
We treat the first fifteen minutes as the expensive part. A team that wrongly blames itself rolls back healthy code and pages the wrong people, and a team that wrongly blames the provider waits while its own bug keeps failing requests.
In this post we cover what the July 16, 2026 CloudFront outage showed about status pages, why they lag, a five-step protocol, the signals that settle attribution fastest, second-order dependencies, rehearsed workarounds, and the case where it really was your change.
What July 16 Showed About Waiting for the Status Page
On July 16, 2026, CloudFront returned errors to customers using VPC Origins from 07:45 to 11:18 UTC. Classmethod's log analysis of the incident quotes the AWS Health Dashboard's final report, which attributed it to an internal constraint on the fleet that manages connections to private VPC origins.
Public timelines put AWS's first status update at 08:44 UTC, about an hour after errors began. For that hour, teams looking only at the provider's page saw nothing wrong while their checkout pages and APIs failed.
The failure was also narrow. Distributions with other origin types kept serving, so the same CDN looked healthy for one team and dead for another. That detail is exactly what a symptom-shape check is designed to catch, and we come back to it in the protocol.
Why the Status Page Trails the Impact
A provider has to confirm that a problem is real, widespread and not one customer's misconfiguration before it posts publicly. At AWS scale that confirmation takes time, and we plan around the delay rather than resent it.
The public page is also not the only view. The AWS Health documentation notes that the public service health page "only shows public events, which are not specific to an AWS account," and recommends signing in to see events that affect your own account and services.
So we check the signed-in account view and the public page, and we never let either one stand in for our own measurements. A green provider page means the provider has not announced a problem yet, not that there is none.
A Five-Step Answer to Is AWS Down or Is It Us
We run the same five steps in order, with a rough time box for each, because each one removes a class of suspects before the next starts.
1. Rule Out the Last Change in Minutes Zero to Three
We check deploys, configuration pushes, feature flag flips and infrastructure changes in the window before errors began. If nothing changed, our own code moves down the suspect list, though it does not leave it.
2. Read the Symptom Shape in Minutes Three to Seven
Errors that hit users everywhere at once point at global services such as DNS or the CDN, while errors in one zone or region point at regional infrastructure. Errors generated at the edge point at the CDN or firewall layer, while application exceptions point deeper into compute.
Feature-scoped failures are the strongest clue. On July 16 only distributions using CloudFront VPC origins, which connect CloudFront to load balancers and instances in private subnets, were failing. When only one kind of traffic fails, the fault is usually in the feature that traffic shares.
3. Compare Internal Health With External Probes in Minutes Seven to Ten
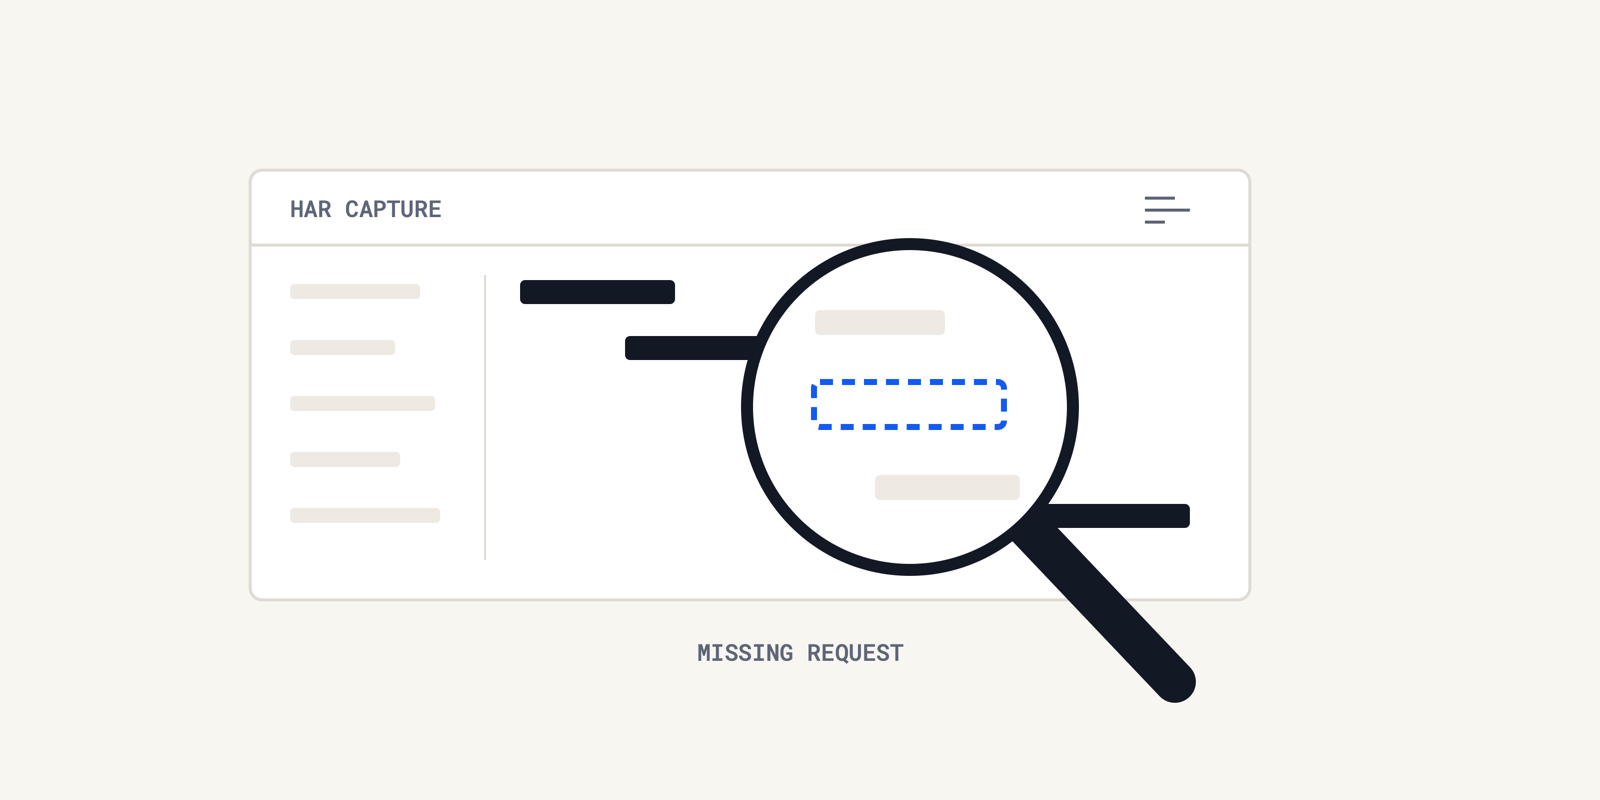
We compare what the system reports about itself with what an outside probe sees. If internal checks are green and external probes fail across regions, the break is between users and our servers, which often means upstream. Probes should bypass caches and request a path that reaches the origin, or a CDN serving cached pages will hide an origin failure. We run them from at least three regions so that one probe's own network trouble does not decide the question.
4. Check the Dependency Inventory in Minutes Ten to Thirteen
We check the identity provider, payment gateway and other vendors that run on the same cloud. Their own status pages and support channels sometimes report faster than the provider's, and their failures can look like ours. We keep that list with status page links and support contacts, because hunting for a vendor's status page mid-incident wastes the minutes the protocol is meant to save.
5. Decide the Path in Minutes Thirteen to Fifteen
We pick one of three paths and say it out loud in the channel.
- Workaround, when a rehearsed bypass for the failing service exists.
- Failover, when the failure is regional and another region is healthy.
- Communicate and wait, when a global provider service is down and no bypass exists.
The third path is not giving up. It frees engineers to stop changing healthy systems and puts effort into clear customer updates instead.
Differential Telemetry Is the Fastest Honest Signal
We call the comparison in step three differential telemetry, internal health against external reachability. It is fast because it needs no access to the provider, and honest because neither side can be talked into the answer we hope for.
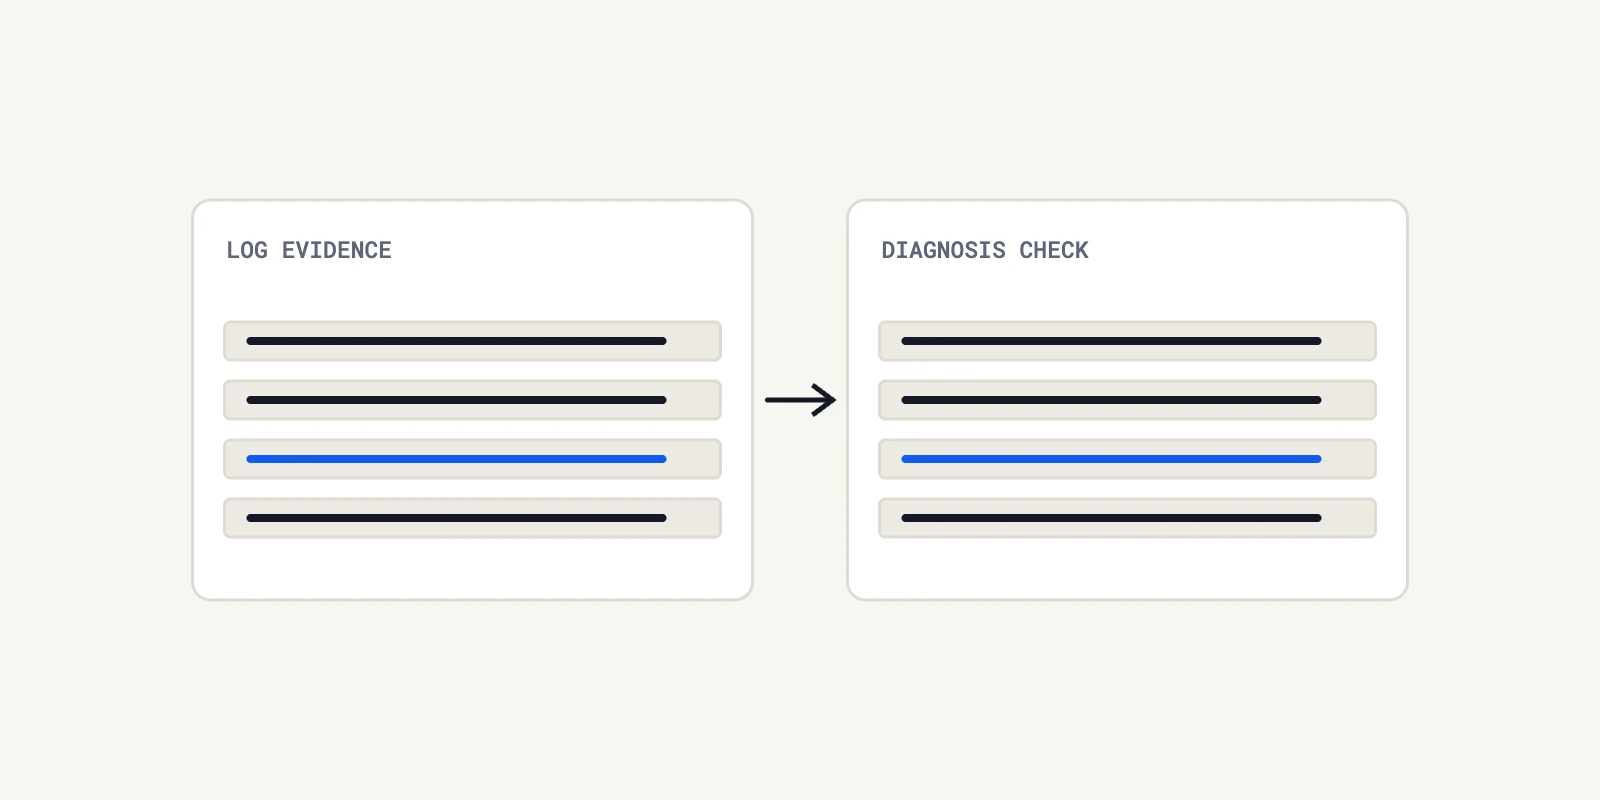
Logs add detail. Classmethod's analysis found CloudFront response times sitting at about 30 seconds during the incident, matching their configured origin timeouts, along with connection errors and 5xx responses. Responses that cluster at a round timeout value usually name the timer that expired, as we explain in the 504 gateway timeout ladder.
Pulling deploy history, edge logs and external probe results into one view is slow by hand at 07:50 in the morning. That cross-check is the work of an AI agent that investigates with evidence, which can read those sources at once while the on-call engineer runs the protocol.
Second-Order Dependencies Fail on the Provider's Schedule
You can be hit by a provider service you do not use. On July 16, services including Frontegg, Canvas and Blackboard were reported as affected, so customers of those services saw failures in otherwise healthy applications.
We keep a dependency inventory that lists not just what we run but what our critical vendors run on. The same blind spot applies to AI model providers, where fallbacks that look independent often are not, as we found in correlated model provider outages.
Rehearsed Workarounds Beat Clever Ones
Public timelines record that AWS advised changing the origin type at 09:21 UTC. For most teams that meant an infrastructure change and a CDN redeploy in the middle of an incident, which is a risky moment to try something for the first time.
Creative Force's incident retrospective shows the payoff of acting on it. The team rerouted traffic through a network path outside the affected VPC Origin configuration and restored service by about 10:00 UTC, 78 minutes before AWS confirmed full recovery at 11:18 UTC.
We write and test the bypass for each critical provider feature in advance, including its security implications. A workaround rehearsed in a game day is an asset, and one invented under pressure is a second incident waiting to happen.
When It Really Is Your Change After All
We do not let the protocol become a way to blame the provider early. A deploy can coincide with a provider blip, and step one exists so the team looks at its own changes before anything else.
Multi-region architecture does not settle the question either. When a global service such as a CDN or an identity provider fails, every region that depends on it fails together, so a healthy failover region tells us little about which side broke.
If the evidence is mixed after fifteen minutes, we keep both hypotheses open and split the team, with one pair on the provider path and one on our own changes. Root cause analysis afterwards should record which step settled the question, so the protocol gets sharper with every outage.
Prepare Your Is AWS Down Answer Before the Next Outage
We would set up external probes from several regions, write the dependency inventory, script the workaround for each critical provider feature, and draft the customer message for an upstream outage. Then the question of if AWS is down gets answered from evidence within minutes.
After the incident, the customer-side write-up still matters, which we cover in AWS outage postmortem lessons. For the investigations in between, Operate brings the evidence from logs, databases and code together through read-only adapters, and proposes any code fix as a patch file an engineer reviews and applies.
Frequently Asked Questions
We check three things together. The public AWS Health Dashboard, the signed-in account view for events affecting our resources, and our own external probes from several regions. A green public page alone does not prove AWS is healthy, because public updates can trail the impact by an hour.
The AWS Health Dashboard names the affected Region for each event, but global services such as CloudFront are not tied to one Region. We compare error rates per Region in our own telemetry, since a failure in one Region and a failure everywhere point to very different causes.
It depends on which service fails and how widely. A regional problem affects workloads in that Region, while a global service failure can hit every Region that depends on it. We also see indirect impact, because vendors built on the same provider fail at the same time.
There is no typical duration, because each event differs in scope. The July 16, 2026 CloudFront VPC Origins failure lasted about three and a half hours. We plan for multi-hour events by preparing workarounds and customer messages instead of hoping recovery comes quickly.
Slowness and failure often look alike at first. We look at response times clustering at a timeout value, which usually means an upstream hop stopped answering, and at error codes generated at the edge. If internal checks are healthy and only external paths are slow, we look upstream first.
About the author

Operate Team
The team behind Operate
Operate Team builds Operate, enterprise AI agents for production operations. Operate answers production questions from Slack and Microsoft Teams, investigates alerts, and reviews performance, security and cost. It finds the root cause with evidence and proposes a fix for an engineer to review, with controlled access to your systems.