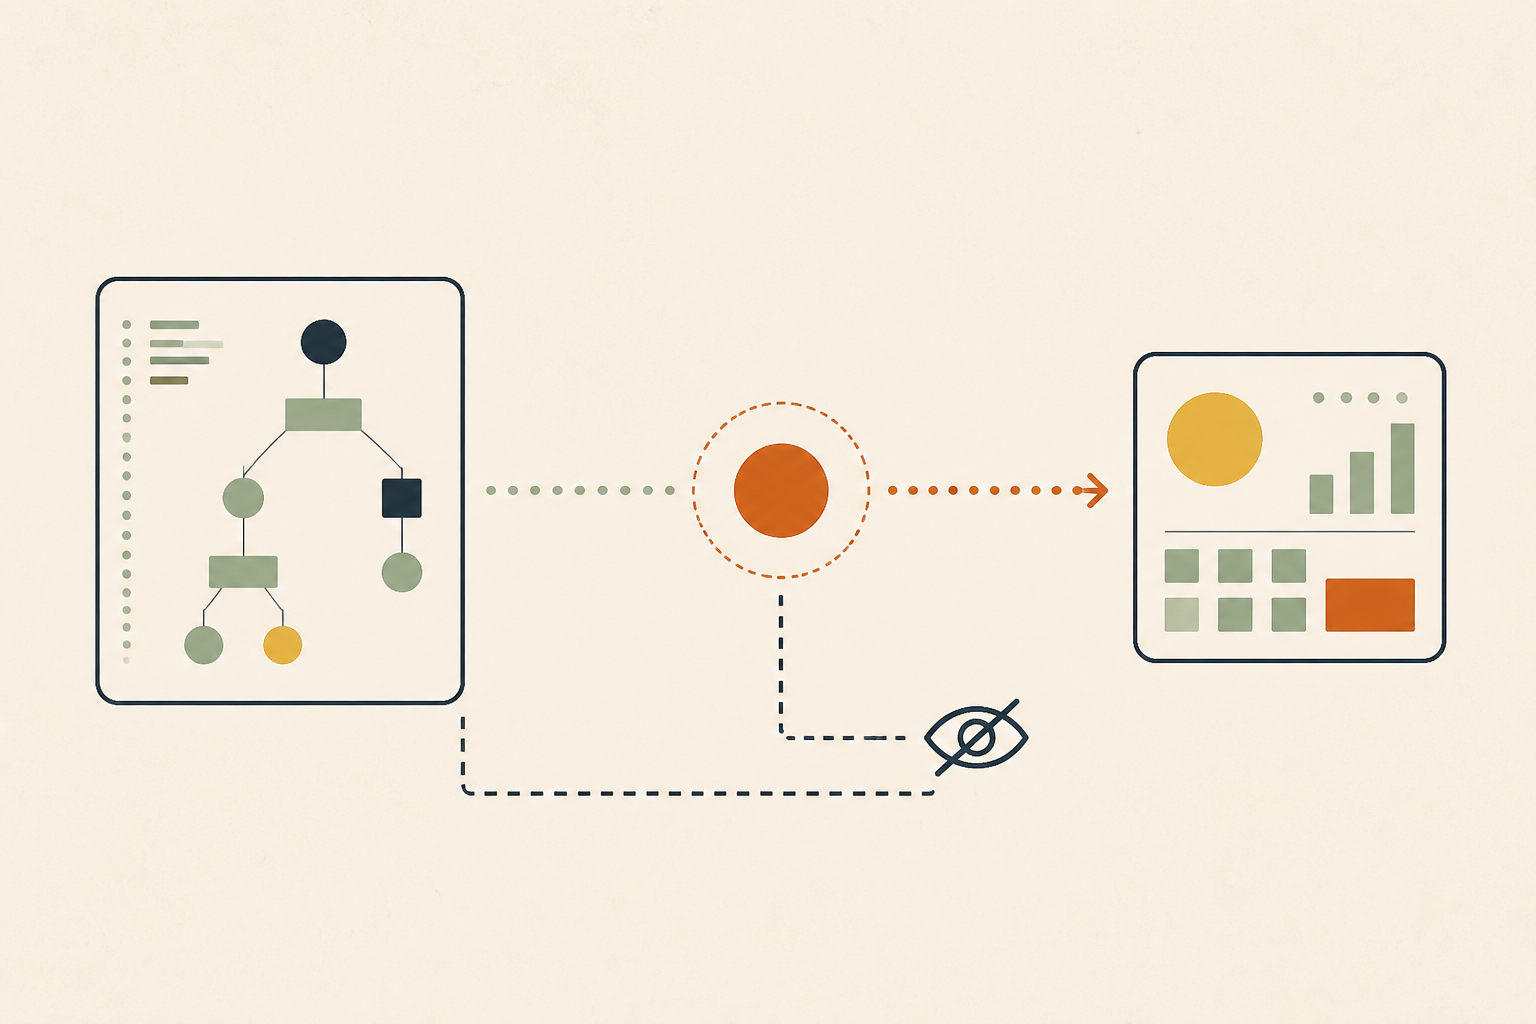
The Only Production Regression That Gets Routed to Finance: Nobody Who Can Read the Query Plan Ever Sees the Bill
TL;DR: A warehouse cost regression is simply a performance regression measured in dollars instead of milliseconds, yet the signal is routed to finance teams who cannot act on it rather than engineers who can. By treating cost drift as a proactive case rather than a late-arriving invoice, organizations can close the feedback loop between the query plan and the bottom line.
Two regressions, one difference
Imagine a query that historically took 200ms suddenly spiking to 2 seconds. The monitoring system triggers an alert, an engineer receives a page, and a fix—usually a missing index or a reverted schema change—is deployed within hours.
Now imagine that same query, which previously scanned 40 GB, suddenly starts scanning 4 TB. The latency might remain stable, but the resource consumption has increased a hundredfold. This second event is functionally identical to the first: it is a production regression. It likely shares the same root causes—a query plan flip, a lost partition filter, or a SELECT * added in a hurry. Yet, this regression does not generate a page. It generates a line item on an invoice thirty days later. Because the signal travels down the invoicing pipe rather than the alerting pipe, the person who can see the number cannot read the plan, and the person who can read the plan never sees the number.
What the invoicing path lacks that the alerting path has
This routing failure exists because we tolerate three properties in the invoicing path that we would never accept for operational monitoring:
- Latency: The feedback loop for warehouse cost is measured in weeks, while latency is measured in seconds. You cannot debug a query plan regression effectively when the evidence is a month old.
- Attribution: An alert knows exactly which service and owner are responsible. An invoice usually knows only an account or a broad cost center.
- Actionability: The recipient of a finance dashboard lacks the technical standing to open a terminal and rewrite a query. The person who can rewrite the query has no standing to see the invoice.
Any one of these would disqualify a channel for reporting a latency regression. We tolerate all three for cost, leading to a permanent separation of the problem from the solution.
The twelve times that nobody reviews
The cost of this separation is not marginal; it is orders of magnitude. According to Amazon Athena pricing documentation, the storage decisions made by engineers can change the cost of a single query by a factor of twelve.
Consider their own worked example:
- A 3 TB uncompressed text table queried for a single column scans the entire 3 TB and costs $15.00 (at $5 per TB scanned).
- Compress that same data with GZIP to 1 TB, and the identical query costs $5.00.
- Store it in a columnar format like Parquet with the same compression, and the engine reads only the referenced column—scanning just 0.25 TB. The identical query now costs $1.25.
Twelve times the price for the same answer, decided entirely by a storage choice that is rarely revisited after the initial setup. Furthermore, billing mechanics like the 10 MB minimum per query and rounding up to the nearest megabyte mean that high-frequency small queries can create a cost floor that no query optimization can solve—only an architectural change can.
Why the pattern repeats in every warehouse
Whether you use Snowflake, BigQuery, or Athena, the organizational outcome remains the same. In on-demand engines, cost is a function of bytes scanned, meaning spend is determined by what the storage layout allows the engine to skip. In credit-based engines like Snowflake, cost is a function of warehouse time, meaning spend is determined by the duration and complexity of the work.
In both models, the lever sits with engineering, but the number lands with finance. This is why commercial intent keywords like snowflake cost optimization and bigquery cost optimization carry CPCs as high as $39.56 and $22.44. These figures reflect a market where enormous money is spent by procurement teams chasing a problem that can only be solved by the people writing the SQL.
Key Takeaway: You do not have a warehouse cost problem; you have a routing problem where the cost signal is delivered thirty days late to the only person in the building who cannot fix it.
The audit that one engineer already wrote
In a recent Substack note, practitioner Amrut Patil outlined a concrete monthly audit procedure:
- Rank tables by bytes scanned.
- Rank principals (users/services) by bytes scanned.
- Assign an owner to the top three tables.
The first two steps are technical analysis, which almost every FinOps tool performs. The third step is the only one that actually changes the bill, and it is entirely organizational. The fact that such a logical procedure often receives little engagement highlights the core issue: we are looking for a tool to fix a responsibility gap.
Routing it properly
Fixing this requires a four-step routing change:
- Attribute spend to the query: Tag every query with its specific cost in credits or bytes scanned.
- Attribute the query to the code: Use comment tags or labels to link the query back to the service and repository that issued it.
- Attribute the code to a team: Use the existing
OWNERSfile or on-call rotation data. - Treat drift as a case: Put sustained cost changes through the same review path as a latency regression, but with a deadline measured in weeks rather than minutes.
The counterargument: Avoiding alert fatigue
The primary objection to this approach is that routing cost to engineers creates a new stream of non-urgent alerts, leading to immediate fatigue. This is a valid concern. Cost drift is not a "page-at-3-AM" event.
The resolution is to treat cost drift as a case, not an alert. An alert asks a human to go investigate a mystery. A case should arrive with the evidence already attached: the query, the "before and after" plan comparison, the scan volume trend, and the specific commit that triggered the change.
Why this matters
The gap between infrastructure spend and engineering visibility is widening. As evidenced by discussions on r/aws, silent defaults—like a 1024MB Lambda memory setting or a warehouse auto-suspend timer—can cause massive cost drift that remains unattributed for months. Closing this gap is not about saving pennies; it is about reclaiming the feedback loop that allows for high-performance engineering.
What to ask on Monday
To determine if your organization has a routing problem, ask these five questions:
- Can you name the three most expensive queries in your warehouse?
- Can you name the specific engineers or teams who own them?
- If one of those queries tripled in cost next week, who would find out, and how long would it take?
- Is any part of your storage layout still a default that nobody has revisited?
- When a plan regression doubles a query's cost but leaves its latency unchanged, what in your system notices?
Solving this proactive work is exactly where Operate excels. Because no single query is "broken," these regressions often survive for years. Operate watches production and opens its own cases for this category—alongside slow queries and schema drift—arriving with the query plan change and scan volume trend already assembled. It produces a patch file for a human to review before opening a PR. It is self-hosted and read-only, ensuring that your data stays private while your warehouse stays efficient.
Sources & further reading
- According to Amazon Athena pricing, storage format choices can result in a 12x price difference for the same query.
- The Athena cost audit procedure by Amrut Patil emphasizes assigning owners to the top three tables by scan volume.
- Discussions on infrastructure defaults reveal how unmonitored settings drive silent cost drift.
- Arguments on the query optimizer as a model harness highlight why cost and plan regressions are inextricably linked.