The Login Service Did Not Go Down. It Stopped Answering
TL;DR The Salesforce outage on September 16, 2026, was caused by a fail-slow cascade where an internal login service stalled rather than failing outright, exhausting server resources across the fleet. This incident highlights why slow dependencies are more dangerous than dead ones: they consume caller capacity (threads and sockets) through waiting, leading to a wider blast radius and complicated recovery efforts.
On September 16, 2026, thousands of engineering teams found their CRM integrations, automated workflows, and customer portals grinding to a halt. While news outlets rushed to report the "global outage," the real story was unfolding in the granular updates provided by the Salesforce status API. These updates revealed a classic architectural nightmare: a dependency that wasn't dead, but was instead answering so slowly that it poisoned the entire ecosystem.
Understanding the mechanics of this salesforce outage is critical for any engineering leader managing a distributed system. When a core service like authentication stalls, it doesn't just impact login; it consumes the finite resources of every service that calls it, creating a resource-exhaustion cascade that can be harder to recover from than a total blackout.
What Salesforce actually said, in order (UTC)
According to the official Salesforce status records (Incident 20004433), the timeline of the disruption reveals a struggle with a "fail-slow" scenario rather than a simple crash.
- 07:50 UTC: The first signs of impact emerge. Customers began experiencing issues accessing the Salesforce application and multiple services.
- 08:32 UTC: The incident is officially posted to the status page.
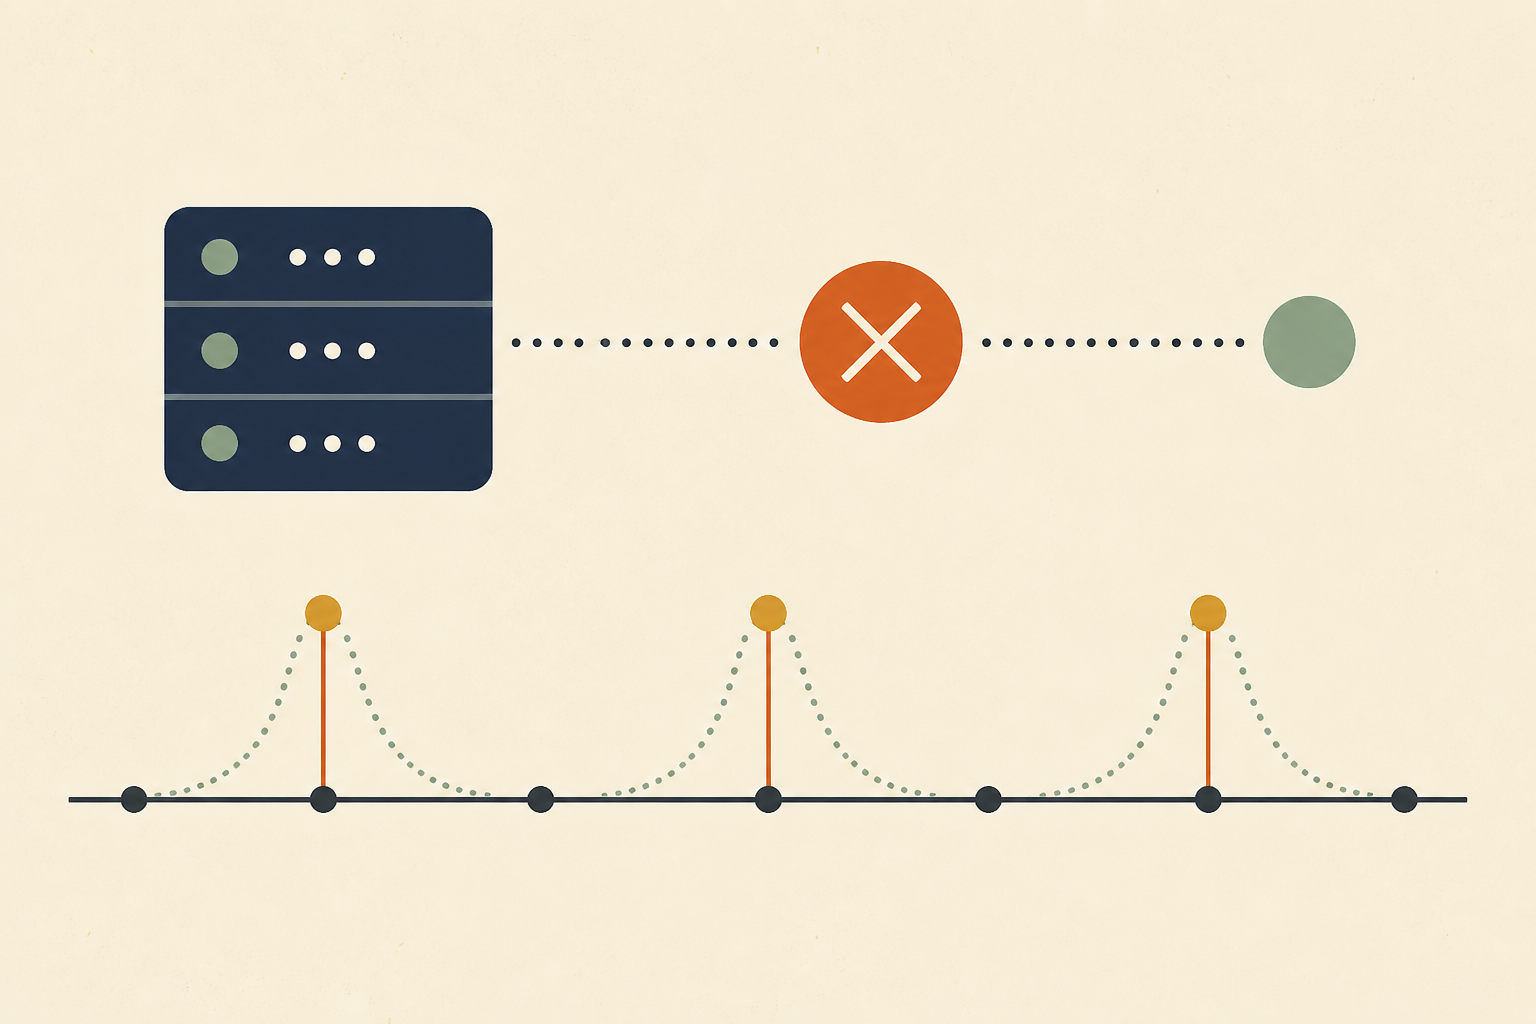
- 09:10 UTC: The smoking gun appears in the logs. Salesforce reports: "requests are stalling while waiting on a response from an internal login service, which is using up available server resources."
- 09:57 UTC: Investigation points toward an external dependency failure affecting the legacy login server. Crucially, the external provider claims no third-party issue exists on their end, suggesting a complex interaction between the two environments.
- 10:01 UTC: Technical teams note they are "no longer pursuing restarts" as a primary mitigation strategy, likely because clearing the buffers didn't stop the incoming stall from immediately refilling them.
- 10:18 UTC: Core components show increased load across the board as the stall propagates.
- 10:56 UTC: A potential fix is validated and a fleetwide rollout begins.
- 12:39 UTC: Despite the 10:01 update, teams find that manual restarts are now required for specific instances to clear the backlog of stalled requests.
- 13:13 UTC: The rollout is found to have not fully completed; teams begin reapplying the fix to the remaining segments of the fleet.
- 15:26 UTC: The primary impact ends, nearly eight hours after the initial stall.
- 15:39 UTC: The blast radius is narrowed. While initially appearing global, Salesforce identifies the impact was concentrated on a subset of Hyperforce instances.
- 18:59 UTC: The incident is marked as resolved.
As of September 23, 2026, the official Root Cause Analysis (RCA) remains pending. What is not yet said is which specific dependency failed, exactly what the "fix" entailed, and why the timeouts in the login service didn't trigger earlier to protect the calling server resources.
Why a slow dependency is worse than a dead one
In the world of Site Reliability Engineering (SRE), we often prefer a service that crashes to one that drags. A "fail-stop" service returns a 5xx error or closes the connection immediately. This allows the caller to handle the error, perhaps by serving cached data or showing a clean "service unavailable" message, and—most importantly—to move on.
A "fail-slow" dependency, like the one seen in this salesforce outage, behaves differently. It accepts the connection and the request, but it doesn't send a response. The calling service is forced to wait. While waiting, that caller holds onto a thread, a memory buffer, and a TCP socket.
Key Takeaway: A dependency that answers slowly can take down more than one that fails outright; check the timeout, isolation and slow-response behavior of your own shared login or session service.
Because login services sit on the critical path for almost every interaction—API calls, UI navigation, background jobs—a stall in the login service becomes a stall in everything. If your web server has 200 worker threads and 200 users try to log in while the service is stalling, all 200 threads are now occupied doing nothing. The server is "alive" but cannot process a single new request, even for pages that don't technically require a fresh login check.
Three details worth noticing
Looking closely at the status updates, three operational details stand out for platform owners:
- Restarts are a double-edged sword: The team abandoned restarts at 10:01 UTC, only to realize by 12:39 UTC that they were necessary. Restarts clear the "held" resources (threads/sockets) that were consumed by the stall. However, if the underlying stall persists, a restart is just a momentary relief before the service chokes again. The shift from "abandoning" to "requiring" restarts suggests the team finally found a way to stop the stall, but needed to manually flush the "poisoned" instances.
- The "Partial Success" of Fleet Rollouts: The 13:13 UTC update stating the fix "did not fully complete for a number of instances" is a reminder that in large-scale cloud environments, a "fix" is rarely a single button press. Fleet rollouts require per-instance verification. If you rely on a provider like Salesforce, your specific instance might be the one where the automated patch failed to apply.
- The Revised Blast Radius: Early in an incident, the blast radius is almost always overestimated or underestimated. By 15:39 UTC, Salesforce narrowed the scope to Hyperforce instances. As an operator, this means your initial "is it down for everyone?" check might be misleading. You must monitor your specific integration health rather than relying solely on global headlines.
Three questions for your own shared auth or session dependency
The salesforce outage should prompt every engineering team to look at their own internal "login" or "session" services. If that service stalls tomorrow, does your system survive?
1. What is the timeout, and is it shorter than the caller's deadline?
If your API gateway waits 30 seconds for your Auth service, but your Auth service waits 60 seconds for a database, your gateway will always be the first thing to exhaust its thread pool. Deadlines should always be shorter as you move "up" the stack.
2. Is its capacity isolated (bulkhead)?
Do requests that don't require an auth check (like a health check or a public asset) share the same thread pool as those that do? Implementing a "bulkhead" pattern ensures that a stall in the login path doesn't prevent your monitoring system from seeing that the rest of the app is technically healthy.
3. What does your service do when it answers slowly?
Most integration tests check for 200 OK and 500 Internal Server Error. Few tests simulate a socket that stays open for 29 seconds before sending one byte. You should know exactly how your middleware and connection pools behave under high-latency conditions.
The customer-side aftermath nobody writes down
While Salesforce was recovering, the systems depending on it were entering a second phase of crisis. When a major provider goes down for 7.5 hours, the resolution of the incident is only the beginning of the recovery for the customer.
- The "Gap" in Scheduled Jobs: Any Apex jobs, Scheduled Flows, or external cron jobs (like ETL syncs) that were set to run during that window simply didn't. Many of these do not "auto-resume" for the missed window; they simply wait for the next scheduled interval, leaving a 7.5-hour data hole.
- Retry Storms: When the login service finally started answering, every integrated system (Zapier, Mulesoft, custom Python scripts) that had been backing up likely attempted to retry all at once. This "thundering herd" can often cause a secondary outage.
- Reconciliation: Finance and RevOps teams must now reconcile records. If a lead was captured in a web-to-lead form but the API stall prevented it from hitting the CRM, that data might be sitting in a dead-letter queue—or worse, lost in a browser session.
Why this matters
We are in an era where "up" and "down" are no longer binary states. As systems become more distributed, "slow" is the new "down." The September 16 incident is a textbook example of why we cannot just monitor for errors; we must monitor for resource consumption and latency distribution. According to CIO.com, these cloud dependencies represent a hidden risk where the age of the service matters less than its position in the dependency graph. A legacy login service can be the single point of failure for a modern, global cloud.
Common pitfalls
- Assuming a "Resolved" status means data is current: Always check for missed asynchronous jobs after a provider restores service.
- Over-relying on global status pages: As seen in this incident, status pages are often updated manually and reflect the provider's current hypothesis, which may change multiple times during the event.
- Increasing timeouts to "fix" flakiness: This is the most dangerous move. Increasing timeouts during a stall only ensures that your worker threads are tied up for longer, accelerating the resource-exhaustion cascade.
Sources & further reading
- According to the Salesforce Status API, the resource exhaustion was explicitly linked to a stalling login service.
- According to The Register, the timing of the outage overlapped with major industry events, complicating communication.
- According to CIO.com, the outage exposes how temporal data problems can arise even when the service is technically "back."
During a vendor outage, the first question is always "is it us or them, and what did it break on our side?" Operate can answer that from Slack for anyone, correlating integration error logs, job scheduler history, and latency on the calls to the vendor. Once the provider recovers, Operate can automatically generate a list of the scheduled jobs that did not run and identify data gaps in your integrations. It operates in a read-only capacity for investigation; any suggested fix is a patch file that a human must review and approve, ensuring privacy and auditability even in the wake of a major provider failure.