Observability Cost Is a Hedge Against Bad Investigations
Observability cost is mostly a hedge, paying to store answers you rarely read. Split telemetry into detection, transient state and data you can query later.
Quick Answer
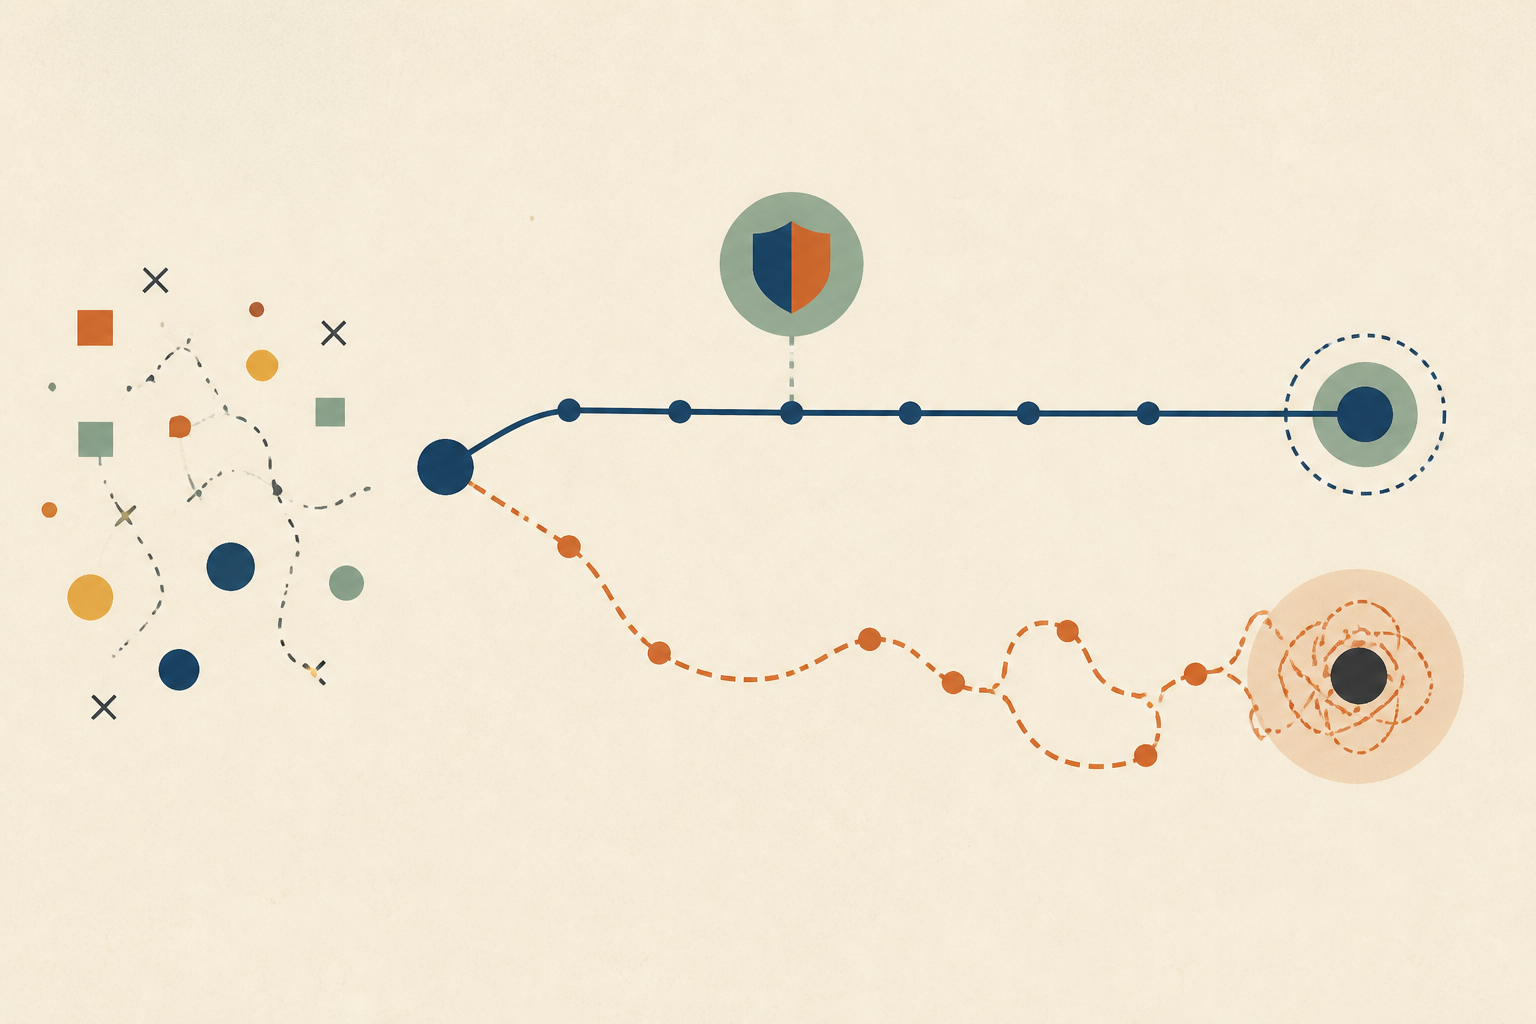
Observability cost grows because teams pay to store every answer they might need during an incident, then read only a small share of it. Supply-side tactics such as sampling, filtering and cheaper retention tiers help, but they leave that premise untouched. The bigger lever is splitting telemetry into detection data, transient state, and investigation data that can be queried from the source system at incident time instead of shipped in advance.
Observability cost is what a team spends to collect, ship, index and retain the metrics, logs and traces it uses to run production. It grows with every service a team adds, and the renewal meeting is often where nobody can explain each line.
We think most of that spend is a hedge. We store answers in advance because we fear the incident where we will need data and not have it, and the premium grows with every service we add.
In this post we cover why the bill is hard to defend, what supply-side optimization can and cannot do, three buckets that decide what each stream is worth, how to measure what you actually read, why AI traces are growing the hedge again, and when storing everything is the right call.
Why Nobody Can Defend the Observability Bill Line by Line
Ask a platform team to justify each item on its observability invoice and the answers get vague quickly. Custom metrics that no dashboard reads, debug logs nobody has queried since staging, and indexed tags that never appear in a query all keep billing every month.
Google's SRE book has a blunt rule for this in its chapter on monitoring distributed systems. "Signals that are collected, but not exposed in any prebaked dashboard nor used by any alert, are candidates for removal."
The reason those signals survive is not technical. They are insurance. We keep them because one bad night without the right data feels worse than a large, steady premium, and nobody owns the trade-off between the two.
What Supply-Side Cost Optimization Can and Cannot Do
The standard advice for lowering an observability bill works on the supply of data. We use all of these and recommend them.
- Drop debug logs at the edge before they are shipped.
- Sample traces, keeping the ones with errors or high latency.
- Aggregate high-volume logs into metrics before ingestion.
- Move older data to cheaper storage tiers that are slower to query.
- Remove duplicate streams and unused custom metrics.
Tail sampling is the most targeted of these. The OpenTelemetry sampling docs describe it as the approach "where the decision to sample a trace takes place by considering all or most of the spans within the trace," so a team can keep the interesting traces and drop the rest.
What none of these tactics question is why the data is collected at all. They all assume an investigation can only use telemetry that was shipped and stored before the incident started, so the only way to save money is to keep less of it. That assumption is where the larger saving hides.
Three Buckets That Decide What Observability Cost Is Worth
We sort every telemetry stream by the job it does. The job decides where it should live and how much we should pay for it.
1. Detection Data Belongs in Hot Storage
Error rates, latency, throughput and saturation tell us something is wrong. They are low in volume, high in value and read constantly by alerts, so they earn fast, always-on storage. We do not economize here. What we do trim is cardinality, because one label with an unbounded value, such as a user ID on a metric, can multiply the series count without improving detection at all.
2. Transient State Must Be Captured Before It Disappears
Some evidence exists only for a short time. Kubernetes events are a good example, since the kube-apiserver reference lists a default --event-ttl of one hour. A pod that restarts or a node that scales away takes its state with it, so this data has to be captured when it happens or it is gone.
3. Investigation Data Can Often Be Queried at the Source
The detailed data used to find out why something broke is usually the bulk of the bill, and much of it still exists in the system it came from. The pg_stat_statements module already tracks "planning and execution statistics of all SQL statements executed by a server." The Kubernetes API holds current pod status, git history records every change, and logs can sit in cheap object storage until an investigation needs them.
Querying those sources at incident time moves cost from storage to the investigations a team actually runs. When we compare investigation tools on that basis, we look for published, usage-based pricing so the cost tracks investigations rather than stored bytes.
Querying at the source has its own conditions. The source has to be reachable during the incident, the access has to be read-only so an investigation cannot make things worse, and the queries have to be light enough not to add load to a system that is already struggling. Where those conditions fail, the data belongs back in the first two buckets.
The table below is the checklist we run on each stream at renewal time.
| Question | If yes | Where it lives |
|---|---|---|
| Does an alert or dashboard read it to detect problems? | Keep it hot | The observability platform |
| Does it vanish when a process, pod or node goes away? | Capture it at the moment it happens | A short-retention store |
| Can it be read from the source system during an incident? | Stop shipping it centrally | The source system |
| Is it kept only for audit or compliance? | Archive it | The cheapest cold storage |
| Is it kept just in case, with no clear use? | Cut it | Nowhere |
Measure How Much of Your Stored Telemetry Is Ever Read
Before changing anything we measure the hedge. Many platforms expose query or audit logs, which makes the read ratio possible to estimate.
- Export a quarter of query logs from the observability platform.
- Group queries by the index, log stream or metric namespace they touched.
- Compare that list with what was ingested and billed over the same quarter.
- Flag every stream that no alert, dashboard or human query touched.
- Review the flagged streams with their owners before turning them off.
We run the same exercise on telemetry retention. If nobody has queried data older than two weeks in the last quarter, paying to keep thirty days hot buys comfort rather than evidence, and an older tier usually serves the rare exception.
The flagged streams are the premium with no claims against it. We expect pushback on a few of them, which is healthy, because each objection names a real use that should then be written down.
A team also needs someone who owns the trade-off. Savings are booked quickly while the reliability cost arrives later, a gap we explore in who owns the reliability bill.
Why LLM and Agent Traces Are Growing the Hedge Again
Just as teams brought microservice telemetry under control, AI features added a new kind of trace. Debugging a retrieval pipeline or an agent means recording prompts, retrieved context, tool calls and outputs, and those records are large and varied by design.
Teams are reluctant to sample them because model behaviour is hard to predict, so the store-everything instinct comes back at a higher price per record. We apply the same three buckets, keeping detection signals hot and sampling the full payloads. Seeing what an agent did is also a different problem from judging if it was right, as we cover in agent observability versus evaluation.
When Pre-Collected Telemetry Is Worth Every Byte
We do not argue for shipping less in every case. Detection data and transient state must be collected in advance, and so must anything the source system will not keep long enough to investigate.
- Regulated records that must be retained for a set period, whoever reads them.
- Systems that disappear by design, such as short-lived containers and serverless functions.
- Security evidence, where an attacker may delete what lives on the source.
Retention windows also need to outlast detection, or the evidence is gone before anyone knows there was an incident. We explore that failure in the FAA 25-hour rule, and the database monitoring version of the cost question in what database monitoring tools cost.
Audit Your Observability Cost by What Each Stream Is For
We would measure the read ratio, sort every stream into detection, transient state or investigation, and stop shipping investigation data that the source system can answer at incident time. Root cause analysis then pulls what it needs when it needs it.
Observability cost falls fastest when the investigation model changes, not just the pipeline. When an incident does need investigating, Operate can help. It brings the evidence from logs, databases and code together through read-only adapters, and proposes any code fix as a patch file an engineer reviews and applies.
Frequently Asked Questions
They are what a team pays to collect, ship, index and retain metrics, logs and traces about its systems. In our experience the largest share comes from storing and indexing high-volume logs and traces, and a good part of that is rarely read after it arrives.
It is the work of lowering that spend without losing the ability to detect and investigate problems. We start with sampling, filtering and cheaper retention, then go further by deciding which data must be stored in advance and which can be queried from the source when needed.
Not quite. Monitoring watches known signals and alerts when they cross a threshold. Observability is the broader ability to ask new questions about a system's behaviour from the data it produces. We treat monitoring as one use of observability data, focused on detection.
The size and variety of what each trace records. Prompts, retrieved context, tool calls and model outputs make every record large, and teams hesitate to sample them because model behaviour is hard to predict. We keep summary signals for every call and sample the full payloads.
It is a planned limit on observability spend, usually tied to infrastructure spend or headcount. We find a budget works best when it is split by purpose, with detection funded fully and investigation data justified by how often it is actually read during incidents.
About the author

Operate Team
The team behind Operate
Operate Team builds Operate, enterprise AI agents for production operations. Operate answers production questions from Slack and Microsoft Teams, investigates alerts, and reviews performance, security and cost. It finds the root cause with evidence and proposes a fix for an engineer to review, with controlled access to your systems.