A Dead Letter Queue Needs Owners, Alerts and a Redrive Rule
A dead letter queue only prevents data loss if someone watches it. The metrics, alert thresholds, failure triage and safe redrive steps that keep it honest.
Quick Answer
Monitoring, triage and a redrive rule turn a dead letter queue from a graveyard into a safety net. Alert on depth and on the age of the oldest message against the retention window. Sort failures by class before acting, fix the cause before any redrive, and replay in small, audited batches to idempotent consumers. Set retention longer than the source queue's, because some brokers keep the original enqueue time.
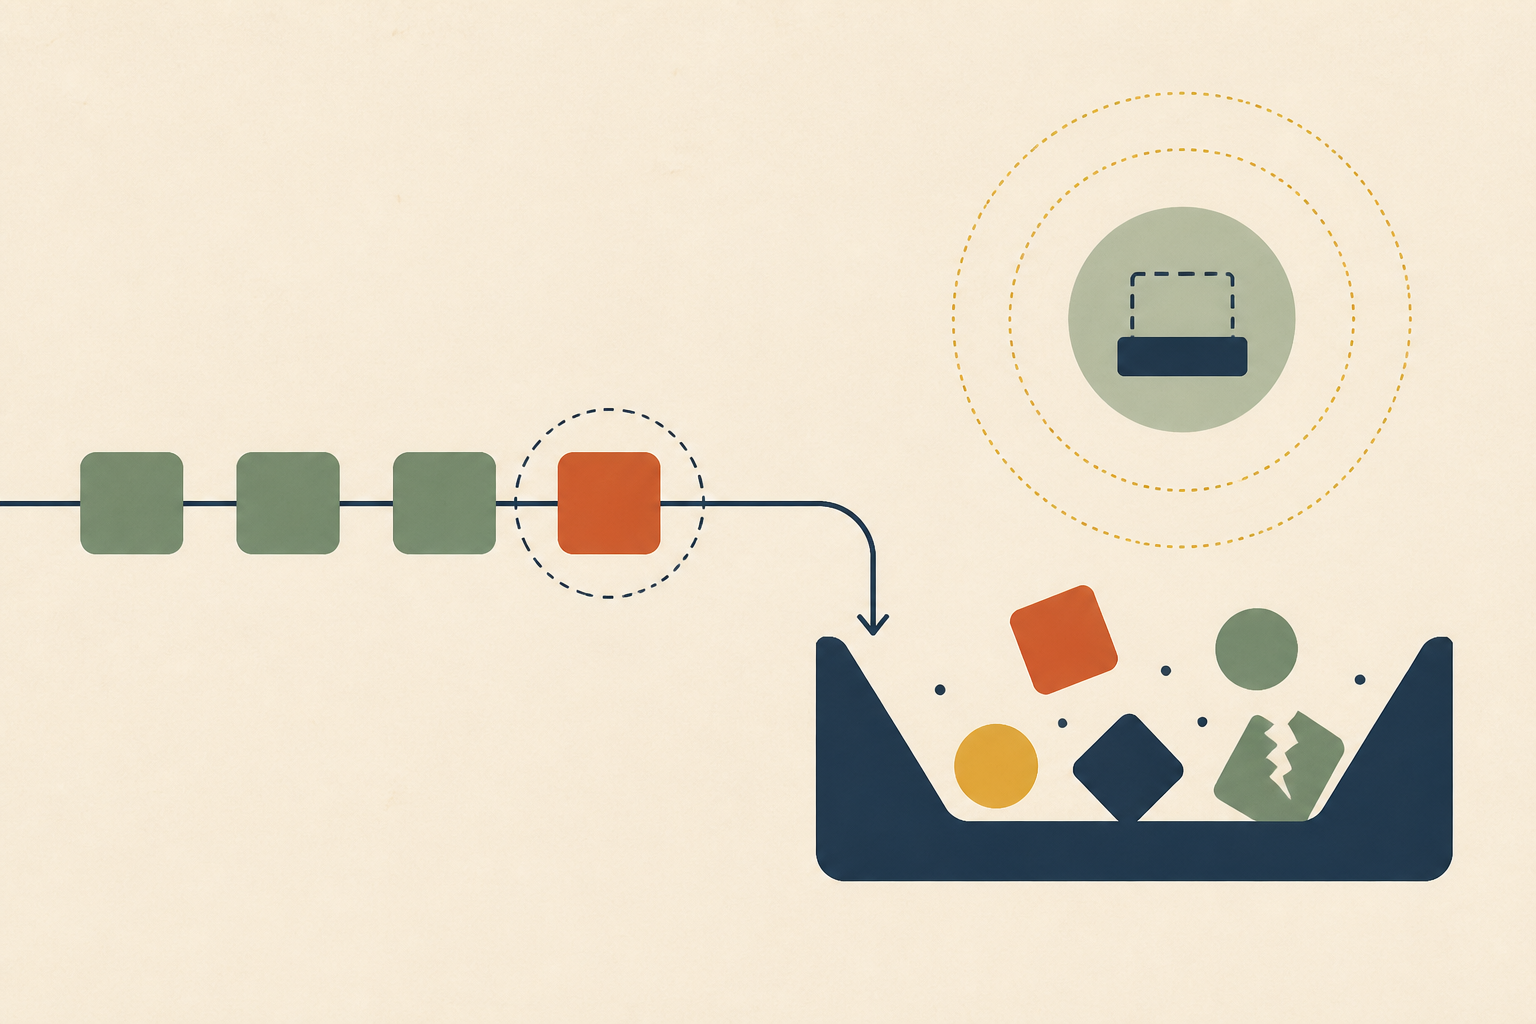
A dead letter queue (DLQ) is where a message broker puts messages that could not be delivered or processed after a set number of attempts. It keeps one bad message from blocking everything behind it. We think of it as a holding area for failures that still need a decision.
Every major broker makes a DLQ easy to switch on, and most advice on dead letter queue best practices stops at configuration. Operating one is a different job. In many systems the DLQ is write-only, so messages land, nobody looks, and the retention window quietly deletes them weeks before a customer notices.
In this post we cover why an unwatched DLQ loses data, the four metrics that make it observable, how to triage failures by class, a redrive protocol, how retention and redrive differ across brokers, and who should own it.
A Dead Letter Queue Without an Owner Becomes Silent Data Loss
A DLQ prevents a failing message from stalling its consumer. It does not prevent the loss of that message. Every message in it is a promise to a user that the system has not kept yet.
The clock is also shorter than it looks. In an SQS dead letter queue fed by a standard queue, a message keeps its original enqueue timestamp, so time already spent in the source queue counts against the DLQ's retention.
AWS's dead-letter queue guide gives the example of a message that spent one day in the source queue being deleted from a four-day DLQ after three days, and recommends setting DLQ retention longer than the source queue's.
Other brokers fail the opposite way. Microsoft's documentation for the Azure Service Bus dead letter queue says "There's no automatic cleanup of the DLQ." Messages stay until someone retrieves and completes them, so an unwatched queue grows without limit instead of expiring.
Both failure modes are silent, because nothing inside the consumer reports them. We wrote about catching this class of failure from the outside in you cannot instrument a silent failure from inside.
Four Metrics That Make a Dead Letter Queue Observable
A single "DLQ is not empty" alarm fires constantly or never, depending on the system. We instrument four signals instead, because each one answers a different question about the failures.
1. Depth
Depth is how many messages are waiting. For SQS, AWS recommends ApproximateNumberOfMessagesVisible as the metric for monitoring a DLQ. The rate of change matters more than the number, since a sudden jump usually means a deploy or a downstream outage.
2. Age of the Oldest Message
Age is the metric that predicts data loss. We page when the oldest message has used about half of its retention window, so someone has days, not hours, to act.
On SQS this needs care. The CloudWatch metrics reference notes that ApproximateAgeOfOldestMessage on a DLQ reflects when the message moved there, not when it was first sent. For standard queues the expiry still counts from the original send, so we add the source queue's processing time to the reported age.
3. Arrival Rate
Arrival rate separates background noise from an incident. A steady trickle from a flaky third-party API may be acceptable, while a vertical line after a deploy is not.
The trap here is that the obvious SQS metric does not measure it. NumberOfMessagesSent excludes messages that SQS moves to a DLQ automatically after maxReceiveCount, so an alarm on it stays quiet during the exact event it was meant to catch. We derive arrivals from the change in visible depth instead, which works while nothing consumes from the DLQ.
4. Redrive Return Rate
After a replay, we track how many messages come back to the DLQ. A high return rate means the cause was not fixed, and the replay only spent another round of retries.
| Metric | Question it answers | Alert we set |
|---|---|---|
| Depth | How much is waiting | Ticket above a baseline, page on a sharp jump |
| Oldest message age | How close we are to losing data | Page at about half the retention window |
| Arrival rate | Is this noise or an incident | Page when arrivals spike after a deploy |
| Redrive return rate | Did the fix work | Stop the replay if returns climb |
These thresholds are starting points rather than rules. We tune them per queue, because a payments queue and an analytics queue tolerate very different delays.
Sort Dead Letters by Failure Class Before Acting
Treating every dead letter the same is the fastest way to make things worse. We group failures by class first, because the right action differs completely between them.
| Failure class | How we recognize it | Safe to redrive |
|---|---|---|
| Malformed payload | Validation or parse error on every attempt | Never without a transformation step |
| Downstream unavailable | Timeouts or 5xx from a dependency, clustered in time | Yes, once the dependency recovers |
| Schema drift | Producer changed a field the consumer expects | Only after the consumer fix ships |
| Business-rule violation | Valid message, impossible action, such as refunding a refunded order | Rarely, it usually needs a person |
| Expired or over-retried | TTL or delivery-count reason on the message | Depends on why the consumer was slow |
The broker usually tells us the class if we read the metadata. Azure Service Bus sets DeadLetterReason and DeadLetterErrorDescription, with system reasons such as MaxDeliveryCountExceeded and TTLExpiredException. RabbitMQ adds an x-death header with the queue, reason, count and original routing keys.
The class tells us what failed, not why, and finding why is root cause analysis. Matching a spike of dead letters to the deploy behind it by hand is slow, so it helps to connect an investigator read-only to your logs and database and let it do the matching.
The Redrive Protocol Starts With the Root Cause
The most common DLQ question we hear is how to clear one. Deleting the messages is almost never the answer, because it destroys the evidence and the work at once. We follow four steps instead.
1. Confirm the Fix Has Shipped
We redrive only after the root cause is fixed and deployed. Replaying malformed or schema-drifted messages into an unchanged consumer just sends them back to the DLQ with one less chance of being noticed.
2. Record Why You Are Replaying
Every replay should leave a trail of who did it, when and why. Notion described building a DLQ Explorer after a long period when the only access was the AWS CLI with direct S3 access. In their tool, "a confirmation modal requires a justification reason before the operation proceeds", and re-enqueue history is tracked.
3. Replay a Small Batch to an Idempotent Consumer
We start with a handful of messages and watch them complete. SQS supports this with a custom redrive velocity of up to 500 messages per second, and AWS recommends starting low and ramping up.
The consumer must be idempotent, because some of these messages may have partly succeeded the first time. We covered why in exactly-once is a property of the write.
4. Watch the Return Rate
If replayed messages start returning to the DLQ, we stop the task and go back to step one. On SQS a redrive cannot filter or modify messages, so a mixed batch needs sorting before it is replayed.
Retention and Redrive Differ Across Brokers
Each broker implements dead-lettering differently, and the differences decide how much time we have. This is the comparison we keep at hand.
| Broker | What the DLQ is | Retention behavior | How to redrive |
|---|---|---|---|
| Amazon SQS | A separate queue named in the source queue's redrive policy | 60 seconds to 14 days, default 4 days, and standard queues keep the original enqueue time | Console or StartMessageMoveTask, back to the source queue or a custom destination |
| Azure Service Bus | A built-in $deadletterqueue subqueue per queue or subscription |
Time-to-live is not observed and there is no automatic cleanup | Service Bus Explorer resend, or receive and resubmit in code |
| RabbitMQ | A dead letter exchange that routes to any queue | Whatever the target queue's own limits are | Consume from the target queue and republish |
| Apache Kafka | No broker feature, a convention of routing failures to another topic | The DLQ topic's own retention settings | A consumer or script that reads and republishes |
Two details in that table bite people. RabbitMQ's documentation warns that dead-lettered messages are re-published without publisher confirms, so default dead-lettering in a cluster is not guaranteed safe, while quorum queues offer at-least-once dead-lettering. In Kafka Connect, Confluent documents that DLQs apply only to sink connectors, enabled with errors.tolerance = all and errors.deadletterqueue.topic.name.
For Kafka specifically, we would also watch consumer lag on the DLQ topic, which we covered in low CPU, no errors, rising lag.
When a Dead Letter Queue Is the Wrong Tool
We like DLQs, but there are two cases where we would not add one.
• Data That Goes Stale in Seconds
Live location updates, presence pings and price ticks are useless a few seconds later. Parking them in a DLQ fills a queue with data nobody should ever replay, so we drop and count them instead.
• Work Where Order Matters
AWS advises against a DLQ on a FIFO queue when breaking the exact order would change the meaning, with the example of edit instructions for a video editor. Pulling one message aside lets later ones run without it. For ordered work we would rather block the group and alert, or keep the failure in the stream with its position, as the outbox pattern on day 2 discusses.
Who Owns the Dead Letter Queue and How Often They Look
A DLQ that belongs to everyone belongs to no one. We assign it to the team that owns the consumer, because that team can fix what the messages reveal.
- Name one owning team per DLQ in the service catalog, next to the consumer.
- Triage on a fixed cadence, such as twice a week, with the goal of driving depth back to zero.
- Page only on age and on sharp arrival spikes, and route steady low-volume failures to a ticket or a chat channel.
- Review replay history in the same meeting, so repeated redrives of one failure class become a bug ticket.
We have found the cadence matters more than the tooling. A team that looks twice a week rarely loses a message to retention.
Make the Dead Letter Queue Somebody's Job This Week
We would start small. Pick the queue whose failures cost the most, check its retention against the source queue, and add an age alert at half the window.
A dead letter queue only protects data when someone owns it, watches age and arrivals, and replays with a reason. When a spike does need investigating, Operate can help. It reads your logs, databases and code through read-only adapters to find why messages failed, and proposes any code fix as a patch file while the redrive decision stays with your engineers.
Frequently Asked Questions
A poison message is one that fails every time it is processed, often crashing or hanging the consumer. The dead-letter queue is where such messages end up after the broker gives up. We use "poison queue" loosely for that destination, but the DLQ also holds expired and undeliverable messages.
It keeps messages that cannot be processed so someone can inspect, correct and reprocess them later, while the main queue keeps moving. We see it as isolation plus evidence. Without it, one bad message either blocks the consumer or disappears after its retries run out.
The broker counts delivery attempts and moves a message aside once it passes a limit or expires. We usually start from the defaults, a maxReceiveCount of 10 in the SQS API and a maximum delivery count of 10 in Azure Service Bus, then tune per queue based on how transient failures really are.
Not as a broker feature. We build it as a convention, where a consumer that cannot process a record writes it to a separate topic with error details in headers. Kafka Connect offers this for sink connectors through configuration, and the DLQ topic needs its own retention setting.
We clear one by fixing the cause and redriving, then deleting only what is truly unrecoverable. On SQS, PurgeQueue deletes messages permanently and takes up to 60 seconds. On Azure Service Bus, each message is removed by receiving and completing it, so we export anything worth keeping first.
About the author

Operate Team
The team behind Operate
Operate Team builds Operate, enterprise AI agents for production operations. Operate answers production questions from Slack and Microsoft Teams, investigates alerts, and reviews performance, security and cost. It finds the root cause with evidence and proposes a fix for an engineer to review, with controlled access to your systems.